31 August 2011

What's Wrong with the Edgeworth Box? (2)

(Part 1)

In Part 1, I explained my view that the Edgeworth Box is used to convince students and other consumers of economic theory that certain social arrangements are inevitable.  It's not so important itself as a pedagogical tool, since others have developed and the issues it was meant to settle have long ago become stare decisis.  But I think it's worth examining as an economic approach to describing reality.

ECONOMICS AS A HEURISTIC METHOD

The literature of economics is full of definitions of economics; readers are invited to use their preferred search engine and find a few.  In recent decades, economics has become much more pugnacious about being a science, with a (a) unique purview over the whole scope of political choice, and (b) comprehensible only to experts in the field.  In other words, as research project, economics have taken upon itself pretensions of universal authority, while pre-emptively rejecting the right of any outsider to criticize its positions.

Economists have implied, in doing so, a sort of motivational force-field around themselves, in which the doctrines they preach are impervious to the corrosive self-interest they impute to others.  While lawyers are quite open about the fact that they are paid to make arguments about legal doctrine by the expected beneficiaries of that doctrine, economists refuse to accept any such second-guessing.  "Markets" are presented as unimpeachably pure, sui generis, and uniquely fit to distribute wealth.  Economists may protest that they are merely engaged in abstractions of a reality too complex to present in fuller detail, but people should notice the bizarre implication that public choice is, ultimately, treated as insidious, while the power of business interests is presented as wholesome and self-policing.

So I propose to answer the question: as a research project, what does economics seek to do?

Economics is a process of binding decision-making to accounting.  Economics tries to explain and improve decisions by presenting them as causing, and caused by, conditions of scarcity, preference, and accumulation.  Humans have agency over their own access to wealth through the ability to produce and accumulate rather than merely hunt and gather.  Production and accumulation bring scarcity into the realm of something humans can control, leading to accounting and commerce, hence to the creation of markets.  This chain is not meant as a history, but as a heuristic.

The effort to link decisions specifically with certain objective, measurable conditions imposes a lot of simplification-by-average; while individuals are crammed with confusing idiosyncrasies, those particular quirks have effects that are much too small to matter with large groups. Likewise, confusion, doubt, and ignorance will cloud the decisions of individuals, but on average, the crowd is expected to know what it needs to know about objective conditions, and not make consistent errors about the future.

On average, preferences define a well-behaved utility function.  On average, expenditures are consistent for categories of goods, and not affected by unit price. And so on.  In most cases, these are not just simplistic, but unrealistically simplistic.  If you see a mountain from a distance of a meter, you see the grains in the granite and the twisted scrub growing out of cracks; back up 20 kilometers, and you see a massive peak that's generally triangular, probably with pale-lavender at the top and darker chiaroscuro near the base.  You do not see a polished cylinder or sphere.

This is justified as producing tolerably good predictions, but it doesn't.  It produces tolerably effective political justifications.

THE EDGEWORTH BOX IN CONTEXT

This brings me back to my abuse of the Edgeworth Box.  The idea was presented in Edgeworth's book, Mathematical Psychics (PDF; 1881), and later wedded to the concept of the Pareto Optimum: a condition where no one's utility can be enhanced without reducing the utility of another.  It's a somewhat nuanced view of conflict, because it implies human relations, even over the very short-run, are neither zero-sum nor yet nonzero-sum; in many cases, there may be distributional problems that can be resolved to everyone's benefit.

At the same time, though, an odd corollary is that, once the market has worked its magic and arbitrage opportunities are exhausted, then social factors are innately hostile to each other.  Solidarity plays no role in this; there is no chance for a group of people to get together and enhance their condition in the face of some powerful force, because the Edgeworth Box implies that they're as unified as they will ever be. Likewise, there's no scope for change.

To be clear: I'm not saying the Edgeworth Box needs to explain any change in the endowments of and B, or suggest that is really A1, A2,..., An, and these guys just need to get together and drive a harder bargain.  That's not for me to say, and I don't think it.  But the whole scheme excludes this as a concept.

(I need to pause here and mention that Frances Ysidro Edgeworth himself had a very sophisticated an nuanced idea, which is not closely related to the usual discussions of welfare economics where one is likely to find an EB.)

We can consider different contexts in which the EB applies:

  1. Trade disputes: here, A and B are "rival" countries.  They are knocking out a trade pact, but the pact is very unpopular domestically.  Why?  Because A and have at least three rival constituencies, specifically, those who are export-obsessed (workers and some business managers), those who are consumption-obsessed (households and investors), and those who are incentive-obssessed (activists for the environment, human rights, etc., who hope to use the trade pact to mandate some common policy in both countries).  While the three groups have massive membership overlap, they also can alter the final outcome.

  2. Political disputes:  acknowledging that the USA is unusual in its bilateral polarization (C.f. most other OECD countries with four political poles, or Japan, with a single pole of varying valence), consider the problem of political disputes between Republicans and Democrats.  The absence of common ground is the result of experts and party caucuses seeking a new constituency to recruit for either side, until there are no loose interest groups. The purpose is not some new modus vivendi; it's the permanent eradication of the rival's potential for control.    The conflict is asymmetric because the Democratic Party itself consists of a huge number of constituencies that are watchful, if not positively enraged, with each other.

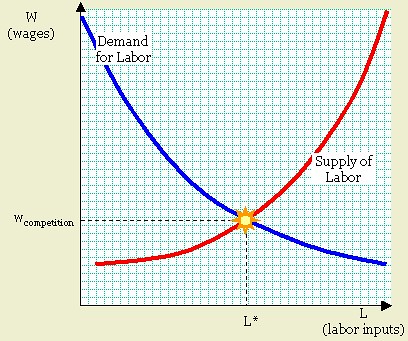
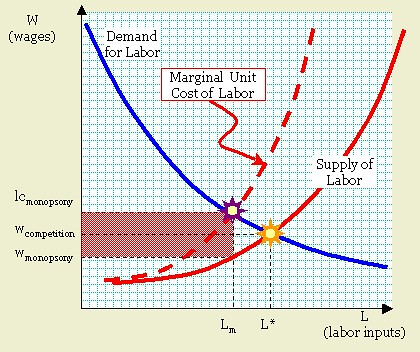
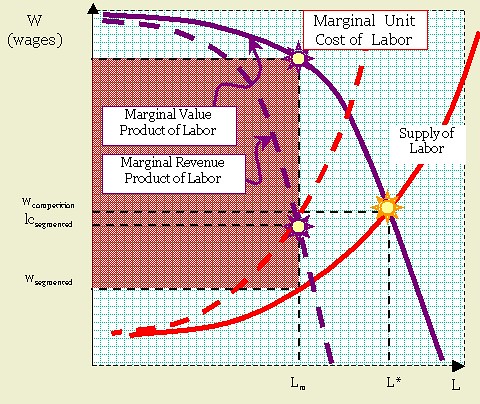
  3. Labor disputes: Again, mine is a US-centric view, but the lengths to which management will go to prevent unions from being organized not in the realm of economic behavior.  Unions have been a successful partner of management in Scandinavian countries and postwar Germany; one can dispute the purity of company unions in Japan, but they are prone to actually showing a flicker of independence.  I suspect this has to do with the evolution of the large American industrial corporation into a quasi-sovereign entity, often with its own (de facto) law enforcement and court system,
Here are three common conflicts that attract a lot of attention, They are modern and plausible. Readers of this blog are unlikely to find themselves in an actual shooting war, and pay negotiations are pretty much random confusion or else unilateral decrees on the part of the employer.  The Edgeworth Box is, in that sense, not applicable to anything real. 


Labels: , , , ,

29 December 2008

Pay-per-use your own computer?

Gregg Keizer, Microsoft specs out 'pay as you go' PC scheme, Computerworld

The idea is something that might have been a story problem in a class on welfare economics: assuming the cost of metering computer usage is negligible, discuss the merits of such a proposal. MS filed a patent for a proposal to sell computers (presumably well below the cost of production), then bill customers for both the use of installed programs and the use of computer power.
Microsoft's plan would instead monitor the machine to track things such as disk storage space, processor cores and memory used, then bill the user for what was consumed during a set period.
So you would be billed x per MIPS-hour, even though this would require you to have the highest-performing processor installed all the time. Also, it would allow you to briefly use premium softwares for hourly (?) rates.

At first blush, this does sound a lot like MS is at it again, trying to squeeze more revenue out of customers for software that is costlier and buggier. A major benefit for MS would be stimulating computer revenue by offering pay-per-use options; note there's an extremely severe recession approaching. With respect to hardware, there would be an obvious relative increase in the incentive to get the most powerful devices, since there would not be a price premium... except on the occasion that you used their full capability. Semiconductor fabricators like AMD might grumble about the price squeeze value-added retailers like Dell were imposing, but really, they'd really only need to ship a larger number of top-of-the-line chips, rather than a mix of different premium chips.

Where the idea gets interesting is software, since the object would be to create a market for much higher-end programs (most likely games, but also business applications). MS could allow users to download "riskfree" programs that had been recently developed, collect revenues, and perhaps stimulate demand. Which opens the question, what exactly would this scheme do for software demand?

Solving a Three-Good Utility Function
Section excised and put in another post

Findings

Usually discussion of utility functions present them as indifference curves between two similar goods. I prefer to think of utility functions as part of firm's production function, in the sense that there's more money to be made with an optimal expenditure on different items. But in the case of an actual business strategy, it makes sense to begin with the understanding that customers can spend money on
  1. high-end software (z)
  2. low-end software (y)
  3. everything else (x).
Usually I use the x-axis to represent "everything else" (example). Textbook writers, sometimes in an effort at humor, will select two very similar items (pizza versus hamburgers) , but assume consumers' expenditures on the two items together will remain the same regardless. I remain curious, though, as to what would happen if you're looking at a market for two similar items, in which most income will be spent on neither. If the price for one goes down, demand for the other may not necessarily go down (as it would if there were only two items).

Another deviation from usual practice is to use the linear expenditure function instead of a Cobb-Douglas function. The Cobb-Douglass utility function is unappealing to me because, while it's easy to use mathematically, it results in a fixed share of income being spent on each good. Logically, if the price of a thing is sharply reduced, you would expect people to spend a larger share of their income on that thing; spending the same amount of money as before now yields more satisfaction, so people will find more occasions to use spend more money on it, not merely buy more units. For some products, the opposite may be true (health care), in which case the threshold level of consumption can be made negative.

The threshold level of consumption is a phrase I made up to refer to what x0, yo, and zo represent: a minimum level of consumption of these respective goods. Consumption of x < x0 means that x ties up income but contributes nothing to utility. As is often the case, extreme conditions are seldom relevant: we aren't usually interested in situations where x < x0. Instead, we're interested in situations where x >> x0, and we're making a modest shift in position. Technically, a negative threshold level of consumption implies that even negative consumption of a thing contributes to utility, to say nothing of no consumption at all. That's absurd. On the other hand, the curve created by a negative threshold may realistically describe conditions in which an increase in prices leads to an increase in total expenditures.


I set up the equation so that threshold levels of consumption were positive for all goods; the price of "everything else" was fixed; high-end software yielded a higher utility per unit, and software generally had a higher utility per unit than "everything else." I found that increasing prices for y actually reduced spending (demand) for z, albeit much more slowly than reducing the price for z.

A lot of this has to do with the coefficients of the utility function: α, β, γ, x0, yo, zo, and I. The values of α, β, and γ determine the gradient of the utility function at I. When creating the graph above, I chose values for β and γ that were much higher than α; that reflects an assumption that ongoing expenditures on low-end software (not to mention high-end software) provide more bang for the buck than money spent on "everything else." That's an intensely controversial proposition, but I doubt it would face controversy at Microsoft.

The values for threshold spending (x0, yo, and zo) are naturally a mystery; high values for x0 and yo (i.e., both "everything else" and low-end software) lower z*, while high values for zo increase z*. All this means is that, if thresholds are high, a price reduction causes expenditures on the good to increase. If threshold = 0, then a price reduction causes expenditures to stay the same. For computers generally, there is strong historic evidence that falling prices have sharply increased expenditures, leading to the conclusion that the threshold value is large but is offset by a high coefficient of utility.

The effect of the original business scheme of Microsoft would lead to a shift in software expenditure from low-end software to high-end, and stimulate spending on software generally. The logic of this is intuitive: access to high-end functionality would be on tap, but users would not have to actually commit to owning the whole package. This would increase the overall utility of software per se.

Labels: , , , , ,

03 July 2008

Robert Blinn on sustainable design

The truth of the matter is that environmentalism and ecological sustainability is a huge subject—indeed, it's the largest possible subject. 

First of all, there's the problem of competing goals: should environmentalism seek to challenge the basic structure of society, on the grounds that it's in an inescapable conflict with sustainability? Or is the object rather to make other social decisions (such as they are) sustainable through [technical] engineering? Then there's the point of view of scientists evaluating costs and benefits of mitigation plans: do we focus on greenhouse gas abatement or toxin abatement? habitat preservation or emissions regulation? 

 In my "Cataclysm" series (link is to part 1) I wrote about ways of thinking about technology. In "Jevon's Paradox" I discussed at least one very important obstacle to engineering our way out of environmental catastrophe. 

Robert Blinn, writing at Core77, also introduces the economic conflicts with environmental protection.
When mankind took up only a small portion of the planet, our growth could subsist on the losses of the far larger animal population. Now, instead of displacing the habitats of others, we're beginning to disturb our own. The "commons" were so large relative to us that our abuses were barely noticeable, but now that we're over six billion strong, our damage is starting to show. We're contributing to what's being termed the anthropocene era, where human pollution is influencing the geological fate of our planet. The commons can no longer afford to be discounted; they're all we have. The tragedy of the commons is a type of collective action problem, a social trap where all parties agree that action should be taken, but gains will not be realized unless they all act as one. While each player knows what would be best for the communal good, self-maximizing choices fail to realize the optimal outcome for all parties.
In practical experience, there really is no resolution to the Tragedy of the Commons besides some enlightened state or meta-state; and even this approach has severe shortcomings.
Looking at the world through such a lens makes one thing clear: Despite our mansions and our roadways, our designer jeans and our iPhones, human beings have made very little. Instead we've transmuted stored energy into temporary value in exchange for long-term waste...It burns stored solar energy to provide the illusion of growth. The amount of stored energy, real value, in the world is actually shrinking. Our process of "growth" is entropic, creating local pockets of order at a greater net cost in energy.
In the comments section that follows, there seems to be some confusion about the idea of zero-sum phenomena in economics. Blinn refers to the consumption of fossil fuels, which represent solar energy in a very concentrated form. 

A basic concept in economics is the idea of future discounting. You can't have your cake and eat it too; and usually economists assume you'd prefer to eat it (now), since future consumption is always valued less than present consumption. Likewise, consider the oceans: they're an example of the commons. The oceans allow for massive movements of their own resources, such as fish, over vast distances. Hence, there's no way of staking a claim over a segment of the ocean's resources and protecting it as private property. 

Individuals have a personal incentive to extract as much value as possible from the commons for their own use. While oil fields are controlled by nation-state "owners" of the surface, the zero-sum issue arises with present-versus-future consumption of such a valuable resource. I had some semantic issues with Blinn's use of the term "zero-sum." His definition of the term (and re-definition for commentor John) didn't make clear that zero-sum transactions do include situations where both parties capture some utility.

An example is terms of trade between two mineral-exporting countries. Since they cannot really increase production over the short run, their wealth depends on the comparative value of their own respective mineral. If one country exports gold and the other oil, an increase in the demand for gold will necessarily reduce the real wealth of the oil-exporting nation (since it has to pay for gold with exports of oil). 

The other problem is fairly basic: the increasing-sum component of the modern world economy arises from the ability to add some value to a product that is greater than the cost of the raw materials. It's not inconceivable that a future USA could consume less of every type of raw material, and still have a higher GDP: improvements in economic or technical efficiency could lead to lighter products of superior usefulness.

Labels: , ,

22 April 2008

Biofuel scam

UPDATE (11 Feb 2014): This article has been substantially revised since initial posting.

One popular idea for addressing energy security, energy "independence," and the trade balance, is biofuels.

The idea is to use modern farming technology to grow sugars that can be converted to fuel for modified car engines, or even biomass energy (e.g., growing plants to be burned for electric energy; the carbon released will be sequestered by plants being grown for more fuel).1 The carbon released in biofuels, likewise, is supposedly captured by the process of renewing them. A major dilemma, however, has been the energy return on energy invested (EROEI) of biofuels in non-tropical regions.2  If EROEI is less than 1, then even very high market prices for gasoline/diesel fuels will not make biofuels economically viable: the energy deficit has to come from somewhere--most likely, the gasoline or diesel the fuel was supposed to replace in the first place.  If the EROEI is greater than 1, but not by much, then erosion and other emissions will more than offset any greenhouse gas reductions from the enterprise.3

In "The Clean Energy Scam," author Michael Grunwald reports on the disastrous impact the biofuel sector has had on the Brazilian rainforest.
Time: But the basic problem with most biofuels is amazingly simple, given that researchers have ignored it until now: using land to grow fuel leads to the destruction of forests, wetlands and grasslands that store enormous amounts of carbon.

Backed by billions in investment capital, this alarming phenomenon is replicating itself around the world. Indonesia has bulldozed and burned so much wilderness to grow palm oil trees for biodiesel that its ranking among the world's top carbon emitters has surged from 21st to third according to a report by Wetlands International. Malaysia is converting forests into palm oil farms so rapidly that it's running out of uncultivated land. But most of the damage created by biofuels will be less direct and less obvious. In Brazil, for instance, only a tiny portion of the Amazon is being torn down to grow the sugarcane that fuels most Brazilian cars. More deforestation results from a chain reaction so vast it's subtle: U.S. farmers are selling one-fifth of their corn to ethanol production, so U.S. soybean farmers are switching to corn, so Brazilian soybean farmers are expanding into cattle pastures, so Brazilian cattlemen are displaced to the Amazon. It's the remorseless economics of commodities markets. "The price of soybeans goes up," laments Sandro Menezes, a biologist with Conservation International in Brazil, "and the forest comes down."

Deforestation accounts for 20% of all current carbon emissions. So unless the world can eliminate emissions from all other sources--cars, power plants, factories, even flatulent cows--it needs to reduce deforestation or risk an environmental catastrophe. That means limiting the expansion of agriculture, a daunting task as the world's population keeps expanding.
It's difficult to to make this connection obvious, especially given the amazingly pervasive greenwashing of biofuels by investors like BP.

The Problem with "Energy Independence"

Ever since the Nixon Administration (and the Arab Oil Embargo of 1973), US leaders have paid lip service to the goal of "energy independence." The concept is willfully vague, in part because ambiguous goals are easier to meet than explicit ones; but one metric of energy dependence might be the share of transport fuels that have to be imported. So, for example, if most transport was powered by domestically-produced electricity, it would be all right if a country imported most of its crude oil since its crude oil consumption played a small economic role anyway.

That's obviously not the case for the United States.

Oil is an extremely important economic input in the US industrial system and will remain so for a long time to come. This is widely recognized, so a lot of advocates for energy independence have called for either increasing domestic production, or else for subsidizing energy substitutes like biofuels.

Increasing domestic production is a motivation behind long-standing tax subsidies for producers, such as the oil depletion allowance.4 This subsidy is quite expensive and consists of a huge subsidy to investors for exploration (especially on federal lands). It has had the effect of increasing the rate of US oil extraction above market levels, meaning that tax policy has stimulated oil depletion of US territory. If nothing had been done, then presumably oil would have been slightly costlier, and the USA would have greater reserves than it actually does. Very likely it would have developed an economy less dependent on cheap oil, and today we would consume less and have more.

In other words, the pursuit of energy independence has, in practice, meant a commitment to more oil of US provenance now, at the expense of more oil in the future. It's meant cheaper oil, but higher taxes, meaning that the US government has intervened elsewhere--just as it did with agriculture--to support prices made artificially low by exploration subsidies. At the pump, oil is taxed less than it is in other industrial countries, but Americans pay higher taxes to subsidize exploration and recovery (since the oil companies pay hardly any taxes, and they can get substantial rebates from the US government just for depleting the government's own oil). This has resulted in greater oil dependency, leading to a secular trend--over long periods of time--to costlier oil, more imports (as domestic output exhausted the low-hanging fruit).

One could argue that the quest for "energy independence" has been amazingly void of serious public discussion. It's a bromide that no one takes seriously.

This is far from unusual, incidentally. Many countries have policies that, taken altogether, are astonishingly perverse. But that's not the point.

The point is that "energy independence" has never been taken seriously by its proponent, other than as a scheme to get more perverse and destructive policies. It can be used to contrive "successful" arguments, or rationales, for "green" subsidies that actually make environmental problems worse. If the object is merely to replace imports of energy with anything, however costly, then "energy independence" is an insidious folly. If the object is to mitigate an actual problem with national accounts, or with environmental impact, then a serious discussion of costs and benefits is far more likely to ensue.


Notes
  1. For an introduction to the concept of "biomass" as a source of electricity generation, see Zia Haq, "Biomass for Electricity Generation," US Department of Energy: Energy Information Administration Annual Energy Outlook (Dec 2001--accessed 11 Feb 2014)


  2. For estimates of EROEI for various energy sources, some options are: Dana Visalli, "Getting a decent return on your energy investment," Resilience blog (12 Apr 2006). Unfortunately, this article does not examine biofuels in detail; it merely introduces the concept of EROEI. One study of Brazilian cane sugar ethanol is Edward Smeets, Martin Junginger, André Faaij, Arnaldo Walter, & Paulo Dolzan, "Sustainability of Brazilian bio-ethanol", Copernicus Institute--Utrecht University  (Aug 2006), whose findings are summarized in Robert Rapier, "Report: Brazilian Ethanol is Sustainable," The Oil Drum blog (6 Oct 2006).  I will freely admit that I have not read the entire 135-page report and am wholly reliant on the summary in The Oil Drum.  Rapier concludes that an estimated EROEI of 8.3(or more) is valid for Brazilian sugar cane.

    Rapier helpfully includes analysis of soil erosion from corn versus sugar cane; Brazilian cane has an erosion rate of about 1.24 t/ha/yr, compared to US corn erosion of 12 t/ha/yr. So even if the EROEI were sharply increased in corn ethanol, this would have a disastrous impact on North American land fertility.

    Estimates of EROEI for corn ethanol in the USA seem to range from 0.9 to 1.65; see Roel Hammerschlag, "Ethanol’s Energy Return on Investment: A Survey of the Literature 1990−Present" in Environmental Science & Technology, 2006, 40 (6), pp 1744–1750. The lower estimate factors in the costs of farm machinery.

  3. For those interested in the subject, there are several issues. Suppose (for sake of discussion) the EROEI for some ethanol cycle is 2. This means for every joule of energy used to produce the fuel, 2 joules worth of energy are "created" (technically, the energy is not created at all, but captured from sunlight by photosynthesis).  That particular sector will consume energy equivalent to its entire output for the rest of the economy, since half of its output--or equivalent--will need to be plowed back into the production process. Even the most optimistic estimates of corn biofuels suggest an EROEI much less than 2 in North America.  "In theory," this would be sustainable, if goofy--if the only environmental impact were greenhouse gas emissions from direct consumption of fuel.

  4. The oil depletion allowance is an exceptionally sweeping tax exemption that allows many profitable oil companies to avoid most taxes. The method of assessing it was changed (supposedly removing some of the oil companies' tax advantages) in 1975, but in fact it was merely re-arranged. The oil depletion allowance was created in 1926 and has survived, and even become more baroque with time. David C. Johnston, Daniel Johnston, Introduction to Oil Company Financial Analysis, PennWell Books (2006), p.67ff. For analysis, see Gary Zatzman & Rafiqul Islam, Economics of Intangibles, Nova Publishers (2007), p.179ff. One does not need to accept Zatzman's and Islam's overall ideological conception to benefit from their explanation of the financial returns accruing from the oil depletion allowance.

Sources & Additional Reading

Michael Grunwald, "The Clean Energy Scam," Time (27 Mar 2008) (via LunchoverIP, Bruno Giussani)

US Energy Information Administration website--extremely valuable source of data for energy price history, global consumption, and so on.

Labels: ,

19 March 2008

Import Substitution

Import substitution is a policy for stimulating economic development in which the immediate object is to stimulate the domestic production of items the country usually imports. An example would be an African nation whose authorities try to replace imports of furniture with local production of furniture.

The purpose of import substitution is manifold. First, a country may well be stuck exporting only items with a low value-added content, such as raw lumber. Such a country might have a ruling elite (indeed, it almost certainly would) for whom a large volume of foreign luxuries are imported, such as cell phones and motorcars. Such a country would suffer from chronic unemployment (with no industries) and current account deficits. The local currency would be worth so little that one could, for example, buy an immense amount of land with euros and expel the subsistence farmers living there, perhaps for use as a game preserve; or one could build a large, extremely polluting factory, contaminating vast amounts of the local groundwater. This was a common thing in the late 1950's, and naturally motivated a lot of independence struggles. But with foreigners or agents of foreigners owning virtually everything, independence was meaningless unless there was some way the local population could get out of debt to the foreigners. Hence, both development economists (in rich countries) and nationalists (in poor ones) favored import substitution because it incorporated a plan to pay the bills.

Another purpose of import substitution, mainly of interest to nationalists, was the development of a middle class. Underdeveloped countries suffer from a weak or nonexistent manufacturing sector, which means any middle class (urban professionals, middle managers, and small entrepreneurs) will be both small and wholly dependent on the government. Such a county will have no constituency for any public investment, no sense of national solidarity, and no civil society. The economy will consist solely of getting raw materials out of the country with as little obstruction as possible from anyone who happens to live there. As it happens, this is a problem endemic to underdeveloped nations and tends to be self-perpetuating.

There are two alternative concepts to IS:
  1. A generalized rejection of modern industry or economic growth; this usually takes the form of a decentralized insurgency;
  2. A neoliberal policy of export stimulation, in which the country's authorities foster existing industries as a comparative advantage."
Alternative one is usually an ad hoc reaction to colonial/neocolonial degradation or social collapse; I am not aware of any state actually adopting this as a policy (because states are inherently expensive and need development to exist); it's a philosophy adopted by conservative insurgents, such as Deobandis or Salafists.1 Alternative two is usually based on the doctrinaire application of abstract economic doctrines to policymaking, while disregarding plausible market conditions. It assumes that the demand for any good can expand indefinitely, provided its production becomes more efficient.


Kindred Concepts: The Developmental State

The policy recommendations for the expansion of a nation's economy take two general forms. One is based on the minimalist state, and is regarded as economically orthodox. It assumes that any nation has a comparative advantage in certain goods, and therefore will benefit by specializing in producing those things for which it is already strong. Accordingly, a country which already exports mainly raw lumber needs to focus on becoming better at exporting raw lumber. This may involve a favorable tax structure favoring investment in logging and barge loading, gutting of environmental regulations, and minimal government services. Economists usually advocate such policies regardless of a country's state of development.

The other policy recommendation is for a developmental state in which state revenues are channeled into some strategic program for economic growth. Developmental states usually include import substitution because a current account deficit or poor terms of trade pose the greatest threat to the less-developed economy.


The Decline of Import Substitution

Import substitution flourished during the 1950's through the 1970's. In regions where it was attempted, results could be categorized three ways.
  1. In countries with a ruling military establishment, such as Brazil (1964-1985), Thailand (1936-present, with interruptions), and Indonesia (1965-1999), import substitution mainly targeted strategic items such as weapons, metallurgy, chemicals, and specialized machinery. Some consumer goods were protected and pressure was applied to foreign companies to add some value domestically. This would be a source of illicit revenue for the ruling elites.
  2. In countries with a civilian political establishment, or those sharing power with the military, IS tended to target consumer goods, such as furniture and some electronic components (e.g., TV sets). The motivation was logical, i.e., it served the general economic needs of the nation rather than the narrow needs of the ruling elite. Over time, these industries stabilized and became competitive. When protection was withdrawn, the substitute industries survived.
  3. In countries with a very weak, precarious political establishment, such as many African nations, IS was determined mainly by urgent conditions; for example, where unemployment was a serious problem, IS targeted labor intensive industries like textiles. The preservation of local jobs was a form of patronage that became more valuable as the jobs themselves became more vulnerable. At a certain point, the regime was compelled to withdraw protection, and the substitute industries collapsed (e.g., textiles in Zambia).
These three distinct patterns have strongly reinforced older distinctions between LDCs. The contrast between regions with rising levels of wealth (China, India) and those with stagnating levels (much of Africa, Latin America) has become more pronounced largely as a result of IS being withdrawn as a viable policy option.
___________________________________
NOTES:

1 Salafism is usually referred to as "Wahhabism," after its founder; it is the state religion of Saudi Arabia. See "Salafism," Hobson's Choice. The Deoband movement that has come to dominate in Pakistan’s seminaries can itself be traced to the reformist Deoband movement established in 1867 in Deoband in Northern India. See Prof. Barbara D. Metcalf, "Traditionalist" Islamic Activism: Deoband, Tablighis, and Talibs," Social Science Research Council (2002?)

Deobandism and Salafism are closely identified with the Taliban of Afghanistan, Lashkar-e-Toiba, and al-Qaeda. Unlike other forms of radical Islam, the Deobandi and Salafism represent hard right movements in their respective societies: movements generally favorable to the established economic elites, if not their current political lackeys. They are also obscurantist and violently oppose developmentalist policies. It is my view that terrorist groups such as Lashkar-e-Toiba, et. al., are motivated chiefly by anti-developmentalism, obscurantism, and dread of a strong nation-state; and Islam is co-opted so that such ideologies can compete ideologically with earlier reformist movements such as al-Ikhwan Muslimun (Muslim Brotherhood).
___________________________________
SOURCES & ADDITIONAL READING:

Bruce G. Carruthers & Sarah L. Babb, Economy/society: Markets, Meanings, and Social Structure, Pine Forge Press (1999)

Susan Margaret Collins & Jeffrey Sachs, Developing Country Debt and Economic Performance: Country Studies--Indonesia, Korea, Philippines, Turkey, University of Chicago Press (1989)

Interesting subtopic:
A.C.M. Jansen, "The economics of cannabis-cultivation in Europe," 2nd European Conference on Drug Trafficking and Law Enforcement, Paris, (Sep 2002)

Labels: , ,

12 September 2007

Jevon's Paradox Revisited

(Part 1)


Click for larger image
Curved red lines represent different levels of "utility" (i.e., general well-being).
Straight blue lines represent budget lines.

Note: the utility curves are derived from a linear-expenditure model.
Utility functions are an extremely important part of economic analysis. When predicting the effects of fuel economy standards on overall fuel consumption, an economist is likely to reach Jevon's conclusions: increased efficiency will lead to increased marginal utility of consumption.

The effect of a change in prices or the shape of the utility function is to alter consumption. An increase in income will lead to an increase in the consumption of both x and y, and therefore of utility U. The shape of the utility curve determines by how much consumption of both goods goes up. Usually, when I explain the concept I set y equal to a particular good of interest, and set x equal to everything else. This is because (a) we are interested in the effect of changes in price, etc. on one particular good among many that people tend to need; and (b) the usual supply-demand curves use the y-axis to represent the price of one particular good.


Reverting to my original analysis in part 1, we see efficiency having the exact same effect as a reduction in gasoline prices. In the chart, petrol prices have fallen 26% so you can now buy 35% more per dollar than you could before (or, conversely, engine output per unit of fuel has increased by 35%).1 The first thing we did was plot the new (dotted) budget line, with its steeper slope. There was an increase in liters of gasoline purchased by 37% and a 1.4% reduction in the physical amount/dollar amount of everything else. Utility has increased from the second red line to the third.


Not content with this, we are still interested in the income and substitution effects caused by this. So I plotted a "utility-equivalent budget line." This is a budget line that passes through the new (higher) utility function; but it has the exact same slope as the old budget line. If the same new level of utility had been achieved as a result of an increase in income (rather than an increase in efficiency) then gas consumption would increase by only 16%, while "everything else" would increase by 8.3%. The effect of increased efficiency was that consumers substituted gasoline for other forms of consumption: gas consumption rose another 17%, while consumption of everything else fell 9%.


The significance of the two effects is not trivial. To the extent that the concepts explained above are to be taken seriously, policymakers can use taxes and subsidies to correct for perverse substitution effects. A fairly common proposal related to peak oil and ACC concerns is to restructure tax policies to offset the substitution effects caused by (say) higher CAFE standards. In other words, it would be necessary to raise gas taxes in order to pay for reductions in other taxes.

___________________________________


This illustrates a shift from one utility function (red) to another (brown)
as a result of more efficient use of y.
Returning to the 2nd approach, we used another computer model to estimate what the effect of an actual increase in efficiency would be. Part of the challenge was applying the linear-expenditure model to gasoline; the first approach merely treated efficiency as a change in budget, whereas the second treated efficiency as a change in the utility function (and hence, in differently-shaped indifference curves). Mathematically, the difference between a linear-expenditure model utility function and the more commonplace Cobb-Douglass one is that the former is actually the latter minus a constant for all values of x and y.


The graph above illustrates the shift in x-y preferences caused by increased efficiency. In the scenario I depicted, the four brown curves represent (left to right) the same four successive levels of utility as the red curves. The same budget line is is tangent to a higher "brown"indifference curve than "red" indifference curve. This time, the increase in efficiency has caused gas consumption to increase by 33% (about the same as the price decline did) but since there's no "income effect," the substitution is much larger: a 20% decline in the consumption of "everything else." Now, to clarify a point I hinted at in the previous entry: this is a bit ominous because the ratio of energy expenditures to other things has increased by a lot more than if we approximated efficiency increases by slashing the "price" of gas. In the first scenario, energy efficiency had gone up, making the dollar worth more (since more energy-intensive stuff could be bought), so the economy become somewhat more energy intensive. In the second scenario, we've faithfully replicated the changed technical conditions, with the result that the economy becomes a lot more energy intensive.


As I've mentioned as often as practical, these utility functions, graphs, and inferences are mostly arbitrary. One of many problems with the utility function, for example, is that it's long been insisted by economists that the function U(x,y) only allows you to supply a rank for different values of x and y. In order to plot these numbers at all I had to create a function in which U was a specific numerical value: 20, 30, 40... The logical implication was that 3 units of gas and 6 units of everything else, say, would produce a utility of 20, whereas if gas were increased to 8, utility would be 40. This does not mean that a 2.67-fold increase of gas consumption will make one twice as happy as before, though; it only means that one is in a position that is preferred to one in which utility = 20.


This may seem like a manageable arrangement unless we consider the thorny problem of comparing different utility functions. With a new utility function we need to compare the utility furnished by old and new bundles of goods, which cannot really coexist in time for purposes of comparison.


A more sensible handling of utility is to begin with the explanation that we aren't really measuring "well-being" in a meaningful sense, anymore than average GDP per capita measures "well-being." We are actually measuring something known more properly as "welfare," which is a rational deduction of well-being based on the ability of an economic actor to exchange or arrange what she has to achieve something nearer to her heart's desire. Welfare, another subject unto itself, could be said to capture this concept.2


_______________________________
Notes:

1 The attentive reader will notice that I'm actually saying fuel efficiency went up by 35%, which is exactly the same as the price of gas declining by 26%. We calculated that the actual amount of money spent on gas, or expenditure, went up 2%, while money spent on other stuff went down 1.4%. An implication of this is that people spent about 40% of their income on gas. This is really an exaggeration, even if we pretend "gasoline" refers to all forms of energy and include indirect purchases of energy, e.g., the share of a pizza's cost that goes towards the gas used in delivery, the natural gas used in baking it, the nitrates used in the cultivation of the wheat and tomatoes, and so on. Still, if we did account for costs like that, I think energy would account for a solid 7% of GDP.

By the way, if I had used a Cobb-Douglass utility function, then the expenditure on energy would remain entirely unchanged. This makes no sense to me: if something suddenly provides more satisfaction per dollar spent, and if you are free to do so, you will tend to spend more dollars on that thing than you did before.

2 See Partha Dasgupta, On Well-Being and Destitution, Oxford University Press (1993), p.70ff. Unusually for this blog, the link goes to a display of the actual page in Google Book where the explanation begins. Dasgupta, however, does not propose to measure well-being/welfare (W) as an alternative to utility, but as an enhanced version of it: freedom plus utility. I think this misses a splendid opportunity.

Labels: , , , ,

23 August 2007

KLEMS-2

An Introduction to KLEMS
(Part 1)

An apparent alternative to the customary two-factor production function, at least for purposes of research, is the KLEMS methodology. KLEMS stands for capital, labor, energy, materials, and [business] services. It is used by government agencies to measure multifactor productivity growth; simply put:

The parts of this equation are:
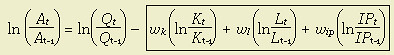
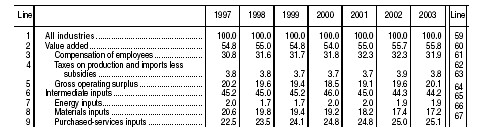
  • is the annual increase in total factor productivity;
  • is the annual increment in output;
  • is the annual increment in capital inputs;
  • is the annual increment in labor inputs;
  • is the annual increment in energy, materials, and business services.
In each case, the contribution is weighted (w) for the presumed contribution of each to actual output. The calculation of wk, wl, and wip is critical, and but quite simple: it's the average of the factor share of income for t and (t - 1). In other words, supposing labor's share was 32.3% in '03, and 31.9% in '02, then wk would be 32.1% for calculating the growth of MFP in the period mentioned.

Using the Bureau of Economic Advisors' '05 Annual Industry Accounts (PDF), table 2, p.11, one can see that output is divided into actual value added (most recently, 55.8%), of which 31.9% was compensation of employees, 3.8% was net taxes, and 20.1% was "gross operating surplus" (or wk + profit—the two are not differentiated in KLEMS accounting). The remainder, 44.2% of GDP, was intermediate inputs of all kinds, including energy (1.9%), materials (17.2%), and purchased service inputs (25.1%).

I was frankly astonished at the low value of we, although it must be noted that much energy consumed would not appear in the ledger as an input; it's a consumer good (crude oil and PNG are material inputs when acquired by, say, an oil refinery; see p.2b).

KLEMS data has been collected on the US economy since 1947, and attracted some fascinating research in the EU (see EU KLEMS project linked below). As expected, this includes studies on the validity of standard production functions normally used in DGE models of the economy. Incidentally, production functions do not use the same method of calculating weights as does KLEMS. KLEMS simply assumes inputs contribute what they are paid. But formally, inputs to an economy will be reimbursed on the basis of their marginal revenue product; it is often the case that some industrial sectors will experience both a high degree of market concentration for output (oligopoly) and a similarly high degree of market concentration for input (oligopsony). When this happens, factor remuneration may be much lower than their contribution to output. While that's not likely to be a huge influence on factor pay for the entire economy, and not for very mobile factors, it does play a role in studies of capital-labor switching within economic sectors. Economists therefore use other methods for researching the contribution of factors to output, mainly through regression analysis of economic growth in different settings.1

According to Houseman (PDF; linked in part 1), KLEMS is fundamentally flawed because of its assumption that factors are paid their actual contribution: Houseman cites the methods of data collection, which rely on employer surveys to measure expenditures on business services (the largest part of IP, above), then forces a match with census data on industry outputs for those same services. The inevitable deficit in expenditures was then distributed among all industrial sectors of the US economy based on the total output of each industrial sector. Moreover, KLEMS data breaks business services into six categories:
  1. temporary help services
  2. employee leasing services
  3. security guards and patrol services
  4. office administrative services
  5. facility support services,
  6. nonresidential building cleaning services
To generate I-O estimates at a more disaggregated commodity level, it was assumed that industrial sectors utilized all contract labor services in the same proportion. For instance, if an industry was estimated to use 10 percent of all contract labor services, it was assumed to use 10 percent of each of the component contract services. The six categories are thus assigned in uniform proportions on the basis of industry output, despite the well-known fact that manufacturing is a heavy employer of temporary help (35-40% of all temps worked in manufacturing).

The other objection Houseman has is that the the equation at the top of the entry reflects a stable equilibrium model, not the dynamic general equilibrium (DGE) model. As she explains in pp.13ff, a shift to outsourced labor (either Ford's use of temps and Cisco's use of Chinese R&D) results in a prolonged but transitional effect of reduced labor productivity, but since the now-outsourced labor is measured as an intermediate service, the loss of labor productivity is suppressed. Put another way, outsourcing is a method of substituting low-cost labor (especially that with a low value of eψu) for capital, but instead of appearing on the ledger as lower labor productivity, less labor is reported being used. Productivity of labor, as reported, will depend on the arbitrary matter of the institutional relationship.

I was also very disappointed in the limited role of energy utilization in measuring efficiency. My entire interest was to examine US adaptation to soaring prices of non-renewables, but when energy inputs are handled as <2%,>NOTES:
1 The estimation of factor shares is a hot-button issue, partly because of the semantics of human capital. My source on growth accounting with human capital is Charles I. Jones, Introduction to Economic Growth, W.W. Norton & Co. (1998), chapter 3.1: "The Solow Model with Human Capital," which is mainly based on Mankiw, Romer, and Weil's "A Contribution to the Empirics of Economic Growth" (1992).

Usually the baseline of analysis is either the Swan-Solow Classical Growth model; immediately after introduction, professors teaching this model nearly always divide Y (GDP) by labor L to get the intensive form y of the equation. Then all attention is focused on estimating how much of y is caused by technology (A) and how much by capital (K/L = k). In Mankiw, et. al., we get introduce the term H (skilled labor), which is
H = eψuL
where u is the amount of time spent learning a skill and ψ is an empirically determined natural log of return to time spent assimilating that skill. According to Mankiw, et. al., including this in a regression of comparative international data leads to a very good fit.
ADDITIONAL READING & SOURCES:

Labels: ,

28 June 2007

A Digression on Returns to Factor

It is not necessarily so that the income that goes to a factor of production—e.g., labor—is proportionate to that factor's contribution to productivity. First, let's consider the extreme case of a monopoly.

Click image to enlarge

The shaded rust-colored area represents the rents captured by the monopolist from the consumer
This is an extreme case, but the difference between the extreme of a monopoly and more common cases of oligopoly (such as price leadership) is not immense. Notice the demand curve for the product is the same as the demand curve for the firm. The curved red line is the marginal cost (MC) curve. The dashed blue line is the marginal revenue (MR) curve; it represents the additional revenue brought in by increasing sales by one more unit.

A few parenthetical notes about the chart: first, I started out with the simplest scenario, in which demand is a linear function of price. In real life, most products have a somewhat concave curve. Second, the point where MC is lowest is chosen arbitrarily. MC may conceivably be downward sloping for the entire range of the graph. For nontrivial examples of a monopoly, though, there's usually a tendency for MC to be rising because of the cost of administration. The shaded represents surplus captured from the consumer by the monopolist (explained). It's the reason classical economists are opposed to monopolies: not because they resent the transfer of wealth, although that's a problem, but the dead weight loss of reduced production and higher costs for all.

Now, let's look at a diagram illustrating factor markets:
Here, labor demand is convex because the same firm is facing a production function in which capital can be substituted for labor. When prices are high, then not only are customers restricted by budget, they have the option of replacing labor with equipment. Likewise, the supply curve is usually understood to become much less elastic as wages rise. Put another way, as wages and hours rise, leisure becomes more valuable to workers as well. Of course, these things are dependent on many things, such as the demand curves for many products, the exposure to foreign markets, and so on. But here, we're using the simple assumption that the demand curves for products are straight & diagonal, and that it's not difficult for managers to substitute capital for labor.

Now, what happens to the demand for labor in a monosonoid firm?
The shaded rust-colored area represents producer surplus captured by the monopsonist from the employee. Note that labor demand for the firm is determined (as before) by the firm's production function, which reflects demand for its products.
Here, there's only one firm with a demand for a specialized type of labor; the most familiar real-life examples are regions. Since the monopsonoid's market dominance is felt in the input market, we would expect to see a deflection from the supply curve. The monopsonoid firm experiences a supply that represents the entire factor market, so when it increases its number of workers, it experiences an increase in marginal wages. This will affect its optimal hiring decision. Hence, it will consider its marginal unit labor cost, which is "inside of" the labor supply curve. It will hire based on the intersection of its internal "demand" for labor (blue line) and the marginal unit labor cost curve. As always, the supply curve will determine wage costs.

The logical extreme is the monopoloid-monopsonoid firm. Again, such an entity is not likely to be seen its pure form, but would illustrate the intermediate-and-plausible case of the oligoloid-oligopsonoid (or segmented) firm, in a market with few participant firms. Here, the concave violet curve reflects the marginal product of labor. For the same reason that the demand for labor was convex, the marginal product declines slowly at first because small amounts of labor can supplement, or replace, a large amount of capital. As L grows, though, the downward slope of the solid violet line reflects the downward slope of the blue demand curve for the product being produced. Moreover, the marginal productivity of labor declines as the amount increases.
The rust-colored area now includes surplus captured from both consumers (above the point lcsegmented) and from the workers (below).
Reflecting the same rationale as the monopoloid firm, we see how the marginal revenue product declines faster yet. Hence, wages are still determined by the solid labor supply curve, but the firm will prefer to cut off further hiring when labor costs lc reach the level lcsegmented. Above the point lcsegmented, the surplus captured is consumer surplus.

Again, while it is true that a genuine double-m firm is rare, and applies to cases like company towns or haciendas, it's not drastically different from the condition in which a market is dominated by a few large firms. As we can see, there will be significant underemployment of labor, which means that employees will be cherry-picked for productivity, and yet this same underemployment (with its high marginal productivity for labor) will mean a low share of GDP for labor as well. Another point to remember is that this applies to other factors as well; for example, materials (especially from former colonies) and energy inputs.

Labels: ,

26 September 2006

Concepts of Efficiency

An important criterion of technology is that it allows for a more efficient version of the productive process. But what is efficiency? There are several conflicting definitions of this term.

Technical Efficiency:
This is the most straight forward definition of efficiency, and it boils down to carrying out the same task with the fewest resources. The application of the term becomes controversial over what defines "same task." Still, technical efficiency is usually the one variety of efficiency that is directly and empirically measurable. A more efficient gas turbine generates more work per unit of fuel consumed; a more efficient refining process requires fewer of at least some inputs, per unit of useful output.

Another term from economic usage is X-efficiency. X-efficiency is the degree of inefficiency in the use of resources within the firm: it measures the extent to which the firm fails to realize its productive potential. For a given set of inputs, productive potential is identified with the point on the production possibilities frontier. X-efficiency arises either because the firm's resources are used in the wrong way or because they are wasted, i.e., not used at all.1

Economic Efficiency:
This refers to the ability of an economic or industrial system to provide what consumers what, given their incomes. This is an idea that is almost unmanageably ambiguous, since "efficiency" implies a comparative virtue, and it is difficult to see how one could make a meaningful comparison between two economic regimes with competing claims to superior economic efficiency.

An immense amount of research into comparative health care systems has attempted to compare their relative economic efficiency, but usually founders on the definitional proviso, "given the consumers' incomes." All health care regimes (and, incidentally, nearly all aspects of all industrial systems), not just "socialized" ones, involve substantial transfers of costs based on the judgment of responsible institutions. In the United States, one form of transfer is between insured and uninsured patients; the latter are charged far more for identical service, but often default on payment.

Setting these stumbling blocks aside, the idea is helpful for understanding the goals of policymakers and designers: consumers want bundles of goods that vary depending on institutional choices of technology. For example, in the 1980's nearly all gas stations in my home state of California became self-service. Obviously, a large number of consumers had preferred full-service; on the other hand, it allowed gasoline vendors to reduce overhead, keep stations open longer hours, and keep stations in areas where the traffic was comparatively lower. As stations turned into petrol vending machines, price increases were somewhat mitigated, and consumers now had access to petrol 16-24 hours a day in the new suburban sprawls. Was the exchange an improvement? It seems highly probable that it was; if consumers had en masse felt otherwise, at least some full-service stations would be found in large, elegant neighborhoods. The self-service filling station was a technology that had to compete with the once-prevailing full-service station. Some consumers complained, but they voted with their dollars and their steering wheels.

I am pretty sure there is no plausible scenario of free choice in which people would chose MS Internet Explorer as their web browser, if an actual market prevailed for software.

Pareto Efficiency:
(Main essay on Pareto Optimization)
This is a more refined notion of economic efficiency. It is the condition where no one may be made better off without making someone else worse off. Put another way, all possible benefits from an economic system have been captured for the participants. Distribution may be very unfair, but it is not wasteful. There is no wasting of potential output due to disuse of labor or capital.

Distributional Efficiency:
This concept is highly dependent on the context. In many cases, distributional efficiency refers to the ability of an institution at distributing benefits to its intended beneficiaries. An example that springs to mind is the design of a very large housing development. Often the designers want to include benefits like WiF in the apartment complex, to make it attractive to renters.
Forever Geek (via Philobiblion): The end result? Residents with laptops can sit down beside the river and work or play online in a calm, scenic outdoor setting, with the same high speed access they have in their apartments. Residents aren’t stuck with dialup, and fixed income residents can now experience the Internet for free, a feature they very much appreciate. They can video conference with their grandchildren and research anything that strikes their fancy, at speeds averaging 4-5 times dialup in busy times.

It’s working very nicely, and the complex is full. Other units that have vacated have been filled, with the final selling point often being the free broadband. And the website has brought in a good number of residents and lots of inquiries about future openings.
This was a success, but other benefits of this nature are a disaster. The most common failures are events, like parties, in which the resident fees pay for a party. Another is the useless park, described here with illustration. Incidentally, in my part of the country (Washington) these "pods" are endemic, and presumably part of the hermetic philosophy of zoning laws in our society. There's several along my preferred evening stroll, and they're usually empty. Strange, because it's late summer and the weather is extremely pleasant. My point is that the design of either building codes or of development layouts have failed to consider distributional efficiency properly. Instead of successfully distributing the utility (goodness, usefulness, pleasure, fun) of the common areas, these developments have wasted about half a million apiece on land that no one uses. Residents drive past the pods, often with their children in the car—whisked off to the mall.

Another, more urgent matter, has to do with the distribution of scarce natural resources in a way that maximizes the utility to society. The most obvious example of this is water. Typically, in many 3rd world countries, water is monopolized by large landowners, who then sell it at a premium to politically allied small farmers, or to industries that avail themselves of the cheap water and opportunities to pollute. Another serious problem is the effect of pollution on water distribution. Usually 3rd world countries are popular as industrial locations (for re-export to the West) not so much because of the cheap labor, but the easy access to cheap water as a pollution receptacle. Historically, national governments are very favorable to mixed-use developments like the gigantic plantation-cum-pulp mill.2

These are examples of distributional efficiency that arise within a [nominal] market economy. In the case of the development, zoning laws mandated those useless "child pods" but then the clientèle of the estate demands insulation from children. In the case of a typical 3rd world rural economy, there is a strong tendency for property rights to be unevenly enforced, so that the country's nascent industrial system "exports" grossly under-priced water (as a pollution receptacle), the landlord collects rents in foreign currency at absurd terms of trade, and the paysannerie suffers a perpetual thirst. Capital accumulation doesn't occur, and the country[side] falls further and further behind the industrialized West.

A misguided objection to the concept of distributional efficiency is that such considerations support forcible redistribution of income. But it's not just college professors pondering issues of social justice that care about distributional efficiency; private corporations that provide services to a paying clientèle have to worry about the stuff they furnish to customers to satisfy them, like swimming pools and gyms in hotels. Most government regulations exist to protect property rights; how does one award property rights in natural resources fairly? Even the most devout libertarians have disputes about this when they are compelled to deal with this in real life.


NOTES:

1 Mark Casson, The Entrepreneur: An Economic Theory, Rowman & Littlefield (1982), p.364

2 gigantic plantation-cum-pulp mill: Chapter One of Death Without Weeping (Nancy Scheper-Hughes, 1993) dealt very effectively with the social impact of a huge industrialized sugar plantation.

SOURCES & ADDITIONAL READING

John Vidal, "Cost of Water Shortage: Civil Unrest, Mass Migration and Economic Collapse," Guardian Unlimited (2006);

Pallavai Aiyar, " Water woes," Frontline-India (2007);
Chandra Bhushan, editor "Not a Non-Issue," CSE India (2004)


SEE ALSO: The Expert's Dilemma

Labels: , , , ,