
KLEMS-2
An Introduction to KLEMS
(Part 1)
An apparent alternative to the customary two-factor production function, at least for purposes of research, is the KLEMS methodology. KLEMS stands for capital, labor, energy, materials, and [business] services. It is used by government agencies to measure multifactor productivity growth; simply put:
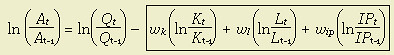
The parts of this equation are:
 is the annual increase in total factor productivity;
 is the annual increment in output;
 is the annual increment in capital inputs;
 is the annual increment in labor inputs;
 is the annual increment in energy, materials, and business services.
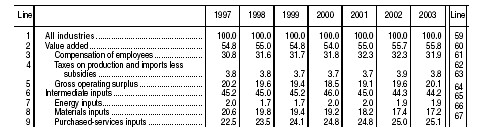
Using the Bureau of Economic Advisors' '05 Annual Industry Accounts (PDF), table 2, p.11, one can see that output is divided into actual value added (most recently, 55.8%), of which 31.9% was compensation of employees, 3.8% was net taxes, and 20.1% was "gross operating surplus" (or wk + profit—the two are not differentiated in KLEMS accounting). The remainder, 44.2% of GDP, was intermediate inputs of all kinds, including energy (1.9%), materials (17.2%), and purchased service inputs (25.1%).
KLEMS data has been collected on the US economy since 1947, and attracted some fascinating research in the EU (see EU KLEMS project linked below). As expected, this includes studies on the validity of standard production functions normally used in DGE models of the economy. Incidentally, production functions do not use the same method of calculating weights as does KLEMS. KLEMS simply assumes inputs contribute what they are paid. But formally, inputs to an economy will be reimbursed on the basis of their marginal revenue product; it is often the case that some industrial sectors will experience both a high degree of market concentration for output (oligopoly) and a similarly high degree of market concentration for input (oligopsony). When this happens, factor remuneration may be much lower than their contribution to output. While that's not likely to be a huge influence on factor pay for the entire economy, and not for very mobile factors, it does play a role in studies of capital-labor switching within economic sectors. Economists therefore use other methods for researching the contribution of factors to output, mainly through regression analysis of economic growth in different settings.1
According to Houseman (PDF; linked in part 1), KLEMS is fundamentally flawed because of its assumption that factors are paid their actual contribution: Houseman cites the methods of data collection, which rely on employer surveys to measure expenditures on business services (the largest part of IP, above), then forces a match with census data on industry outputs for those same services. The inevitable deficit in expenditures was then distributed among all industrial sectors of the US economy based on the total output of each industrial sector. Moreover, KLEMS data breaks business services into six categories:
- temporary help services
- employee leasing services
- security guards and patrol services
- office administrative services
- facility support services,
- nonresidential building cleaning services
The other objection Houseman has is that the the equation at the top of the entry reflects a stable equilibrium model, not the dynamic general equilibrium (DGE) model. As she explains in pp.13ff, a shift to outsourced labor (either Ford's use of temps and Cisco's use of Chinese R&D) results in a prolonged but transitional effect of reduced labor productivity, but since the now-outsourced labor is measured as an intermediate service, the loss of labor productivity is suppressed. Put another way, outsourcing is a method of substituting low-cost labor (especially that with a low value of eψu) for capital, but instead of appearing on the ledger as lower labor productivity, less labor is reported being used. Productivity of labor, as reported, will depend on the arbitrary matter of the institutional relationship.
I was also very disappointed in the limited role of energy utilization in measuring efficiency. My entire interest was to examine US adaptation to soaring prices of non-renewables, but when energy inputs are handled as <2%,>NOTES:
1 The estimation of factor shares is a hot-button issue, partly because of the semantics of human capital. My source on growth accounting with human capital is Charles I. Jones, Introduction to Economic Growth, W.W. Norton & Co. (1998), chapter 3.1: "The Solow Model with Human Capital," which is mainly based on Mankiw, Romer, and Weil's "A Contribution to the Empirics of Economic Growth" (1992).
Usually the baseline of analysis is either the Swan-Solow Classical Growth model; immediately after introduction, professors teaching this model nearly always divide Y (GDP) by labor L to get the intensive form y of the equation. Then all attention is focused on estimating how much of y is caused by technology (A) and how much by capital (K/L = k). In Mankiw, et. al., we get introduce the term H (skilled labor), which is
ADDITIONAL READING & SOURCES:
- Bureau of Economic Analysis, "Guide to the Interactive GDP-by-Industry Accounts Tables" (2007)
- EU KLEMS Working Paper Series, esp. Marcel P. Timmer, Mary O’Mahony, & Bart van Ark, "EU KLEMS Growth and Productivity Accounts: An Overview" (PDF)
- Erich H. Strassner, Gabriel W. Medeiros, & George M. Smith, "Annual Industry Accounts Introducing KLEMS Input Estimates for 1997–2003" (PDF) Bureau of Economic Analysis (2005)
- John R. Baldwin, Guy Gellatly & Tarek Harchaoui"The Role of Analysis in Delivering Information Products" (PDF), Statistics Canada, Microeconomics Analysis Division—see p.8 (July 2004)
- Robert J. Vigfusson, "The Delayed Response To A Technology Shock: A Flexible Price Explanation" International Finance Discussion Papers, FRS (2004); in light of Susan Houseman's study, I am a little skeptical of Vigfusson's rosy conclusions. Vigfusson uses BLS KLEMS data and a flexible price model to argue that, when positive technology shocks are serially correlated, there is a delayed response of labor markets to respond with increased labor.
- staff, "What Is Productivity?" The Ledger, Federal Reserve Bank of Boston (2004)
- John Haltiwanger, "Measuring Plant-Level Total Factor Productivity and Decomposing the Aggregate" (PDF-p.22) Review, Federal Reserve Bank of St. Louis (1997)
Labels: economics, efficiency
posted by James R MacLean @ 5:16 PM
0 comments
![]()
![]()


0 Comments:
Post a Comment
<< Home