
GoogleMapCreator
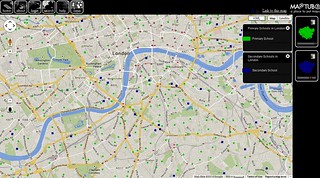 Click for interactive map Link goes to custom map in MapTube made with GoogleMapCreator (CASA, UCL, London) |
A shapefile is loaded into the application and displayed on the screen. [...] The displayed attribute, colouring of the data, geographic extents and maximum zoom levels are defined by the user. Colouring is achieved by setting colours and thresholds for values in the attribute data e.g. any region over 1.0 is red. [...]This software was accompanied by a web hosting service, MapTube, which hosts maps created with GMapCreator.
This is pretty cool, although the output is a bit hard on the eyes. The map appears as a layer in Google Maps although one could introduce a 3rd layer, like an historical map of London.
Hudson-Smith & Crooks paper (PDF--p.11), after introducing GoogleMapCreator and MapTube, turns to the idea of Neogeography, in which the many digital mappings of our world are linked to form a GeoWeb:
The ideology behind such developments can be linked back to David Gelernter (1991) in his seminal book Mirror Worlds: or the Day Software Puts the Universe in a Shoebox.
Gelernter (1991) defines ‘Mirror Worlds’ as software models of some chunk of reality, some piece of the real world going on ‘outside your window’ which can be represented digitally. Gelernter predicted that a ‘software model’ of your city, once setup, will be available (like a public park)… it will sustain a million different views... each visitor will zoom in and pan around and roam through the model as he chooses’ (Roush, 2007).Again, Hudson-Smith & Crooks have something to promote: a virtual London, modelling every building inside the M25, which is notable because they introduce the linkage between (a) a 3rd dimension in maps, corresponding to the built environment (now available for applying data with physical coordinates) and (b) the demands this raises for a navigational environment in a virtual manifold.*
* A manifold is used here in the mathematical sense: the graph in n dimensions of a function of (n - 1) variables. In the simplest form, this is a graph of a function y = f(x), or z = f(x,y). In a computer imaging program, the simulated 3-space visible is accompanied by time coordinates (as, for instance, the effect of the sun moving over a simulated view of London).
SOURCES AND ADDITIONAL READING
Centre for Advanced Spatial Analysis (CASA), The Bartlett (Faculty of the Built Environment), University College of London, UK
Wade Roush, "Second Earth," MIT Technology blog (18 June 2007)
Andrew Hudson-Smith & Andrew Crooks, The Renaissance of Geographic Information: Neogeography, Gaming and Second Life, Digital Urban blog (6 Aug 2008); links to their working paper of the same title (PDF).
Labels: CMS, environment, geography
posted by James R MacLean @ 2:49 PM
0 comments
![]()
![]()


0 Comments:
Post a Comment
<< Home