29 May 2008

Tradable Streams

Every time the topic of high commodity prices comes up, there's a lot of talk about Enron. Can speculation drive up the prices of traded commodities? Of course, Enron proves it. That's the commonsense answer, and I think it would be a good idea to address this in a dedicated post on the subject.

The Story of Enron

Enron was a very large energy company created by a flurry of mergers and acquisitions in the early 1980's. The core firm was InterNorth, a holding company created in 1979 to provide an additional layer of protection from the risks of a rapidly expanding subsidiary, Northern Natural Gas Company. The purpose of Northern Natural Gas was to build and operate 103,000 Km of PNG pipeline connecting Texas and the Great Lakes region. InterNorth acquired a natural gas supplier, Houston Natural Gas, and changed its name to Enron (1985). The following year Ken Lay, took over at the company, and relocated it to Houston.1

Enron remained almost exclusively a PNG supplier and pipeline operator until 1998. That year it attempted to diversify into water; they acquired Wessex Water, turned it into Azurix, and lost about $2 billion trying to turn water into a lucrative business.2 Enron then turned to broadband, partnering with Sun Microsystems to dive into the internet bubble. That, too, was a hugely costly failure that was not wrapped up until November 2001. But Enron's real business was trading in streams.

Streams Explained

A stream (in this sense) is a supply of a benefit that has to be continuous through time. An example of this is electricity. Electricity, for the end user, is something that has to be available at all times. Hence, when streams are commoditized and traded, they are fundamentally different from other commodities. First, there is no possibility of an inventory; electricity cannot be stored. It has to be continuously available to be useful. This means that, as a tradable thing, streams must necessarily incorporate a period during which they are supplied.

Someone might point out that the things I refer to as "flows," viz., crude oil, iron ore, gold, pork bellies, rolled steel, and the like, have active futures markets. Futures contracts specify not only the amount and quality of the commodity to be delivered, but also the date of delivery. But those are derivatives, not the underlying good. Second, a future contract to deliver a load of a particular commodity on a particular day is not comparable to a contract to deliver a stream of service over a period of time. The exact time period of the service is an inherent and permanent feature of the thing being sold.

Examples of Streams

The most obvious examples of tradable streams are
  • pressurized natural gas (PNG);
  • electricity;
other very common examples include
  • water/wastewater;
  • broadband internet connectivity;
  • long distance telephone service;
  • insurance.
The last one is actually the earliest stream to be traded: Lloyds of London introduced the concept of securitizing risk and trading it. Natural gas can only be stored or reshipped with difficulty; usually it is consumed fairly close to the source, although Enron's precursor, Houston Natural Gas, created a complex network of PNG lines spanning thousands of kilometers.

Problems with Trading Streams

As we shall see, this makes trade in streams inherently much more complicated than trade in flows.

The first reason is that packaging a stream (as opposed to an item like an ingot of steel) is likely to sharply impinge on the value or character of that stream. For example, for industrial applications, a kilowatt-hour is not a generic thing at all; often major commercial consumers of electric power require a premium vendor who can ensure no spikes, extra support, and so on. While it's possible to specify different grades of stream, or even unbundle those services and trade them as separate steams, this defeats the point of premium service since the consumer has to essentially replicate the administrative abilities of the premium supplier.

Second, markets don't clear in the same way when the commodity is time-specific. Let me explain again: other commodities can be traded as future contracts, for delivery of a specific amount, quantity, and quality by a specific point in time; a stream is for something that exists only during a period of time, namely, the period during which it is actually used.

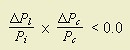
The market price of a thing represents the opportunity cost to the supplier of actually supplying that good to the person paying the price. In other words, commodities have prices because they are scarce, which is to say that there are alternative uses for them. Our market economy uses prices to ration commodities to those who can pay the most for them. However, as the time approaches when the stream bid upon is to be delivered, the price can become highly volatile.3 The total number of buyers and sellers shrinks very fast, which tends to make any "equilibrium price" very unstable. Essentially, basic economic theory gives way to the arcana of game theory and multiple equilibria. The result, at best, is a much more demanding regulatory environment; at worst, unacceptable disruptions in the system of energy supply; and in between, a permanently higher cost (if not price!) of the stream itself.

Part of the problem, naturally, is that both buyer and seller have a gun to the other's head. Trading in streams, in practice, typically involves transactions that take place literally minutes before delivery of the stream for the relevant time period. Since it's not really practical for smaller players to engage in games of "chicken," this restricts stream trading to very large customers.

This doesn't mean the concept is a failure. It does mean that the system only works when it's tightly controlled, as in Western Europe.

_________________________________________
1 Enron does have an extremely interesting history, especially since it consisted of a merger of several older firms. Bryce (2002, see below) emphasizes Houston Natural Gas (HNG) Co. as the core firm, as well as the peculiarities of Houston's business culture. However, Enron appears to have always been something of a bungling conspiracy of its components, rather than an organically unified entity.

2 When Bryce wrote Pipe Dreams, Enron had tried and failed to displace Vivendi (Compagnie Générale des Eaux) and Suez, the two French companies that dominate the market worldwide. As Bryce's book came out, it depicted Vivendi as the seasoned victor of its clash with Enron, which it was in 2000, when Azurix imploded. Nevertheless, Vivendi suffered a financial meltdown at the time of publication, as a result of Jean-Marie Messier's spectacular joyride at the helm (Time). Vivendi's water business is now Veolia Environment.

Suez is still in business; it dates back to the 1850's, although it had taken its current name in 1999 after a merger; its water operations are named "Ondeo," which makes for a much easier Google search. Suez is about to be acquired by Gaz de France (Forbes).

3 An exception to this is Nord Pool, where the balance from the spot market is maintained until the actual, physical delivery takes place under the regulating power market in Norway. Denmark, Sweden, Finland, and Germany are also members of Nord Pool. Another energy trading regime exists in the UK.
_________________________________________
SOURCES & ADDITIONAL READING

Labels: ,

22 May 2008

Commodity Prices and Speculators

Figure 1

Source: International Monetary Fund WEO, Chapter 5
Figure 2

Since the summer of 2007, the world has experienced an extremely rapid increase in the price of many commodities (figure 1); the most obvious is oil, which has recently reached $135 per barrel. The recent climb in oil prices can be said to have begun in January '07 when the 12-month price change reached a cyclical trough and began to rise, becoming positive in March and began to rise (figure 2). Not only have oil prices been rising; the first derivative of oil prices (i.e., the rate at which oil prices have been increasing) has also increased, with the most recent quotes suggesting a 94% increase over the price 12 months ago.


This post will deal with the question of whether or not speculative activity has played a role in the recent run-up of the price of oil. The null hypothesis* is that recent conditions are nothing more nefarious than the adjustment of prices to increasing demand. Rejecting the null hypothesis means we need to acknowledge that speculative activity on commodities markets has led to the recent increases (or contributed somewhat to the size).


SOME THEORY

I'm going to need to introduce some technical terms for explanation.
  • pools: an asset for which the total tradable supply is either permanently limited (e.g., paintings by dead artists, real estate) or represents a share of the total (e.g., equities).
  • flows: an asset that is produced and consumed at fairly high rates, such as oil, copper, wheat, or steel.
  • tradable streams: an exotic type of tradable that includes electricity and pressurized natural gas (PNG). Markets in tradable streams are, at best, not mature and I won't be discussing them here.
  • null hypothesis: In statistics, the negation of the idea one wants to test. When statistics is used to establish a particular finding of fact, there must be an explicit statement of fact that one is seeking to prove (the test hypothesis) and an explicit contradictory hypothesis (the null hypothesis) that one seeks to prove false.
  • inventories: US inventories of crude oil are counted in two ways: commercial and commercial plus strategic petroleum reserves (SPR). The Department of Energy usually supplies statistics on both, but it's commercial inventories that get reported. The SPR is under Congressional control; usually Congress has an incentive to add to the SPR, rather than release reserves, so it should come as no surprise that the SPR is huge: almost 650 million bbls, or twice the commercial inventory. Recently, as prices hit staggering highs, Congress took the momentous decision to desist from further expansion of the SPR.

    The Coleman-Levin report features a chart on p.19 that reveals the oscillation of private inventories (commercial US less SPR); inventories are shown mainly oscillating between 290 and 330 million bbl (i.e, over a range equal to 4 days worth of imports to the USA).
  • strike price; guaranteed price of a commodity at date that futures contract matures. Hence, a future contract for 100 bbl of WTI oil at $150/bbl for 6 months in the future (23 Nov '08), which is currently $18 above the price this exact minute.
  • spot price is the actual quoted price of the commodity
"Pools" and tradable "streams" can be subject to price manipulations; the one through corners, and the other through shorts and derivatives. In fact, the 2000-2001 energy crisis in California was largely the result of intentional manipulation of TS markets by Enron and Reliant Energy Systems.


Figure 3
chart
Figure 4
chart
But "flows" are very difficult to manipulate. Basically, you have to hoard the supply in some way; long-run price controls are really hard to do unless you're the government of a major country and can permanently interfere in the supply. At least, this is orthodox economic theory as I learned it in college. In figure 3, when the demand curve slides to the right, the equilibrium price (p* to p**) will rise, as will the equilibrium flow rate (Q* to Q**). All that that has happened is that the increase in alternate uses for each unit of each commodity (or "an increase in demand") has resulted in a new equilibrium price.

But let's now introduce financial speculators. Suppose they know the demand curve is actually concave with respect to the origin (Figure 4). If one really big investor could carry it off, he could buy a huge amount of the stuff, hoard it somewhere, and then sell it. The price would go up a lot, which would make profit α, while the loss incurred selling the inventory on the world market would be the smaller amount β.

More realistically, speculators don't buy current flows, but future ones: say, oil in six months time. Now, there's no huge tank farms with sequestered inventory, but rather, a bubble in the price of oil to be delivered in December '08. The problem, of course, is that this is always possible; and as the price gets more and more out of line, demand shrivels. But producers of either refined gasoline products, or products that require energy to produce, aren't in a position to know that. So they plan based on the forwards market rather than the spot (or current) price. When Dec '08 arrives, other commodities have gone up in price because production of them really has gone down, in response to the soaring costs of inputs. Of course, the oil producers (Kuwait, Venezuela, etc.) have to adjust production of oil downward in response to the pancaking demand.

LIMITATIONS OF THE THEORY

In theory, speculators who buy commodities future or options (the forward markets) are betting against producers on the price at the time of delivery. Gordon Gecko thinks West Texas Intermediate Crude will be $200/barrel in December; Ellis Wyatt thinks it will be $150. By agreeing to pay Wyatt $175/barrel for oil delivered then, Gecko allows Wyatt to ramp up production to where marginal cost of recovery and shipping is $175/bbl. And if Gecko is right, he walks away with an enormous profit. If he's wrong, and oil is less than $175, then he's already paid for Wyatt's capital expansion; the losses would come out of previous successful bets he's made. The speculator, in theory, absorbs the risk of major short-run fluctuations in price.

But what the speculator can't do, at least in theory, is influence the outcome. Gecko can buy all the options in the world, bidding up the forward price to something astronomical: on the actual commodities markets, the flow of commodities into port facilities all over the world has to match the flow out of them, and the flow out will stop if processors and refiners can't afford them. Several news outlets have suggested that speculators contribute to the high price of petroleum, although without offering details as to how this is possible.

(Examples include Financial Times "Commodity prices part speculative - IMF"; Los Angeles Times, "Are commodity traders bidding up food, fuel prices?")

However, I had heard references to a US Senate Report entitled "The Role of Market Speculation in Rising Oil And Gas Prices" (link below), which alleged that the most plausible price for oil was well below $60/bbl.
Since late 2004, the amount of stored oil in the United States has been increasing. Oil inventories recently reached 347 million barrels – an eight-year high and the largest U.S. inventory since 1998, when oil was $15 per barrel. Similarly, oil inventories in Organisation for Economic Co-operation and Development (OECD) countries recently reached a 20-year high. As the report explains, the traditional factors of "supply and demand" do not tell the whole story on oil and gas prices.

What is new, according to the Levin-Coleman report, is that over the past few years market speculators have poured tens of billions of dollars into the energy commodity markets. For example, the International Monetary Fund reports that over the past three years approximately $100-$120 billion has been invested in energy markets worldwide. Over this same period about $60 billion has been invested in oil futures on the NYMEX.
Bear in mind that that report was published in late 2006, when $60 billion was comparable to about one quarter's worth of US crude oil consumption. Since that report was published, crude oil inventories in the USA have declined somewhat to 320 million bbls. Inventories did indeed reach a high at the end of '06, but Department of Energy statistics show both US and OECD inventories have hovered around 2400-2700 million bbls since 1994 (EIA). And they've fallen off considerably since the late-'06 spike.

One major issue for Congressional investigators was the popularity of commodity indexed funds, which allowed small investors to buy stakes in the movements of commodities. As speculators bought futures in (say) WTI oil for delivery in December, the strike price would presumably soar (this ignores the fact that a booming futures market can include contracts with any strike price, and indeed does: complete listings include the prices for futures at many different prices, including above and below the spot price. Another consideration, though, is the impact of derivatives markets on inventories of the traded commodity: basically, if an index fund is pegged to the price of WTI oil, then the firm offering the fund is presumably obligated to own tangible inventories of the commodity equal to the amount notionally owned by investors buying into the fund.

(I am not aware that this is essential; a fund could instead invest in instruments intended to beat the judgment of amateur investors in no-load funds; in most quarters, the short-run liabilities for the fund would be smaller than quarterly net increases in asset values, and there would be no need to literally match what the investors actually did. So if I offer a fund whose value is indexed to WTI oil, then all I need to do is own financial instruments that match or exceed the growth in value of WTI oil. If there are many other funds offered by my firm, then the risk that I'll fail to do this is greatly mitigated by the fact that in quarters like this one, the losses from the WTI fund will be offset by net gains from the other funds.)

While the Senate report includes a lot of hyperventilating claims about speculation, there's surprisingly little (for a 60-page report) on actual mechanisms for "disconnecting" market equilibria and the price of petroleum. Essentially, everything is riding on a brief spike in oil inventories, and a rather smallish one at that.

There does exist a nontrivial question of volatility, in which refiners are left trying to make decisions about stocks and blends in the face of wildly oscillating futures prices. More precisely, some of the price of retail gasoline at the pump may constitute a premium for uncertainty. But even my Senate report was uncertain if commodity speculation was to blame for volatility.
_______________________________________
SOURCES & ADDITIONAL READING:

Labels: , , ,

12 August 2007

Appendix to Ennumeration Problem: Sexual Orientation Statistics

(Main article)

Folk traditions on sexual orientation are difficult to generalize, but according to official Canadian statistics on the matter, 1.3% of men and 0.7% of women self-identified as homosexual; 0.9% of women and 0.6% of men self-identified as bisexual. The US Center for Disease Control (CDC) has conducted studies of sexual orientation (the Bureau of the Census has not); according to this 2005 report (PDF),
Approximately 1 percent of men and 3 percent of women 15–44 years of age have had both male and female sexual partners in the last 12 months (table B). Among females, 5.8 percent of teens and 4.8 percent of females 20–24 years of age had had both male and female partners in the last 12 months; percentages were lower at ages 25–44.
[p.2c]

The percentages of men and women who reported that they think of themselves as homosexual or bisexual are roughly equal at 4.1 percent. This represents about 2.27 million men and 2.29 million women 18–44 years of age
[4c; stats for sexual attraction suggested nearly identical ratios of sexual orientation, etc. between men and women]
It's interesting to note the CDC statistics tend to rely less on survey techniques ("self-reporting") and more on construction from medical records. It's also interesting to note that CDC research assumes much greater ambiguity in sexual orientation, but also differs from nearly all systems of self-reporting in (a) higher incidence of homosexual orientation than other official surveys, and (b) a higher incidence of homosexuality among women than men.

The well-known Kinsey Report is usually taken to mean that "10% of the population are gay," which is based on the Kinsey rating system (1 = exclusively hetero, 7 = exclusively gay, 2-6 are gradients in between); this refers to findings that 11.6% of white males (ages 20-35) were given a rating of 3 (about equal heterosexual and homosexual experience/response) throughout their adult lives. Even accepting the Kinsey Report findings as accurate, that would still be using a "one-drop" rule for homosexuality. In fact, the Kinsey Reports have serious problems as statistical references on sexuality, including very high proportions of prison inmates, male prostitutes, and (naturally) people willing to discuss the topics.

Mathematics of Sexual Partners
In assessing the explanation of sexual partner estimates, one possible explanation is that the immense disparity in reports by men and women reflects a greater number of same-sex relationships among men. Using a recent study by the National Center for Health Statistics (NCHS), men reported an average of seven partners, while women reported an average of four. Now, an obvious point to acknowledge is that the men reported an average of 7 women, while the women reported an average of four men. However, let's pretend that objection doesn't exist and plow ahead, since I'm merely illustrating a mathematical point.

The total number of relationships between men and women must be equal, since each female relationship with a man corresponds to precisely one male relationship with a woman. So the difference is RM - RF = 3. This is average number of same-sex relationships that men have in excess of the number experienced by women over the course of their lifetime.
2Rmm + Rmf = 7
2Rff + Rmf = 3
The pair of linear equations above features 3 unknowns; setting Rff = 0, Rmf = 3 and 2Rmm = 4, so Rmm = 2, or 28% of all male relationships. That is, to put it mildly, a bit high, especially since the disparity for the USA is rather low. Other international comparisons report ratios of >3:1, mostly in Latin countries. For the UK, it's 2. But based on the information above, it's reasonable to suspect at least some of the women's relationships are lesbian (Rff). How many? According to my calculations, the mean probable interval between lesbian partners is 4.14 years (with some possible overlap). According to the same reporting, the MPI between gay partners is 0.84 years (again, with some possible overlap). Thus, we can gather that the somewhat-smaller "pure lesbian" community reports about one-fifth the number of lesbian relationships, but I have no way of estimating the number of lesbian relationships among bisexual women, or gay relationships among bisexual men. So, while I'm already taking this exercise much too seriously, let's just assume 5Rff = Rmm:
10Rff + Rmf = 7
2Rff + Rmf = 3
Therefore Rff = 0.5, Rmf = 2, and Rmm = 2.5, which means 35% of male relationships are gay.

All this is totally silly, of course, since I'm already ignoring the fact that we have much more detailed self-reporting in the much-cited CDC study. For example, based on prior experience with sex surveys, and the well-known "pairwise paradox," the 2005 CDC study mainly focused on sexual activity in the last 12 months. While it's worth pointing out that the 12-month study period has a much closer mutual correspondence (e.g., 14.8% of men had no sexual partner vs. 13.9% of women; 62.2% of men had exactly one, vs. 66.8% of women; 17.6% of men had >1 partner, vs. 12.7% of women), there are still a few curious disparities: of those reporting two or more partners—which, incidentally, includes those who transitioned from one relationship to another in the last 12 months—3.1% of women reported having partners of both sexes, vs. 1% of men.
ADDITIONAL SOURCES & READING: William D. Mosher, Anjani Chandra, & Jo Jones , "Sexual Behavior and Selected Health Measures: Men and Women 15–44 Years of Age, United States" (PDF), Division of Vital Statistics, CDC (2002); Statistics Canada, "Canadian Community Health Survey" (2004);

A search of Kinsey Institute publications suggests that the word "homosexual" was last used in 1990.

Labels: ,

Enumeration Strategies

P6 alludes to a NYT article about studies on self-reporting of sexual partners. It's extremely common for studies of this type to report that "men have x partners, women have y partners," where x >> y. This is mathematically impossible, which I would think should be obvious. I've heard this sort of statistic repeated ad nauseum, and I've long accepted its unchallenged acceptance as more proof that people either hear evidence of their irrational prejudices, or they tune out and get indignant.
The Myth, the Math, the Sex (Gina Kolata): Everyone knows men are promiscuous by nature. It’s part of the genetic strategy that evolved to help men spread their genes far and wide. The strategy is different for a woman, who has to go through so much just to have a baby and then nurture it. She is genetically programmed to want just one man who will stick with her and help raise their children.

Surveys bear this out. In study after study and in country after country, men report more, often many more, sexual partners than women.

One survey, recently reported by the federal government, concluded that men had a median of seven female sex partners. Women had a median of four male sex partners. Another study, by British researchers, stated that men had 12.7 heterosexual partners in their lifetimes and women had 6.5.
Well, this is impossible. Moreover, forget about prostitution: it holds even in countries where laws against prostitution are not only strictly enforced, but also where prostitution is actually not tenable. But try telling that to commentator "Solar Soul":
It's not mathematically impossible for women to be less promiscuous than men. You just need a small pool of promiscuous women sleeping with a larger pool of promiscuous men. If five promiscuous girls at your high school slept with twenty promiscuous guys, out of a population of 100 guys and 100 girls, then 5% of the girls would be promiscuous, and 20% of the guys would be promiscuous. Sometimes, I really wonder what a PhD is worth.
First, the response is clearly guided by irritation: "I may not know anything about math, but I know women are chaste and men are sex-glutted scumbags." Second, in the example, provided (the high school), Solar Soul is comparing the incidence of arbitrarily-defined "promiscuous ones" in the population of 100 men and 100 women. The example would work slightly better, incidentally, if it used 15 "promiscuous girls" and 60 "promiscuous guys" since at least that way, a majority of the men are "promiscuous" and the majority of women still aren't. It's still far of the mark, though, because the average number of partners is the same for both sexes... which is what the NYT article is all about. It's erroneous to compare modes to modes unless the mode is what you care about, which isn't the case here.

Let's turn now to a (perhaps excessively) serious discussion of the matter:
Norman Brown: If surveys elicit accurate reports from their respondents, heterosexual men and women should, on average, report having had the same number of partners. This is because each new SP for a man is also a new SP for a woman. Thus, for a closed population, men and women must have the same number of opposite-sex SPs, and therefore should generate similar reports. This, however, is rarely the case. Instead, men typically report two to four times as many opposite-sex partners as women.

Wiederman: Rather than a small but statistically significant gender difference, the typical discrepancy in men's and women's lifetime number of sex partners is large by any definition. For example, in national samples, the mean number of sex partners for men and women, respectively, was 12.3 versus 3.3 in the United States (Smith, 1991), 9.9 versus 3.4 in Britain (Wellings et al., 1994), 11.0 versus 3.3 in France (ACSF, 1992), 10.2 versus 4.2 in New Zealand (Davis et al., 1993), and 12.5 versus 5.2 in Norway (Sundet et al., 1989). In populations that are more or less closed systems with an approximately equal ratio of men and women, such as the United States (U.S. Bureau of the Census, 1993), this apparent gender discrepancy does not make logical sense (Einon, 1994; Gurman, 1989).
The operant term here is probably "closed." In some cases, such studies do specify that the respondents are talking about heterosexual contacts; even if they weren't, we'd have to wonder about the conjecture that the massive disparity came from uniquely male homosexuality. More significantly, especially in dense urban areas, it's reasonable to conjecture that numbers of partners are statistically concentrated (like net assets). Put another way, the great majority of people anywhere have 0-2 partners in any given 12-month period, and 1-3 partners in any given five-year period. But it's possible to have a group of, say, 1% of women (sex workers) who are seldom or never surveyed, who account for the greater part of all female sexual encounters; and another group of, say, 10% of men, who have far fewer encounters than the female sex workers, but vastly more than the remaining 90% of men. These 10% would certainly be sufficiently numerous to be represented, even realistically, by a survey like the CDC's; but their partners would be statistically invisible.

This might be true. Weiderman is doubtful, based on Einon's research:
Hypersexual women and prostitutes. Several authors [] have proposed that perhaps the apparent gender discrepancy in number of sex partners is explained by existence of a small subgroup of women who have had sex with an enormous number of men. To address this possibility of a subgroup of highly experienced women who were not prostitutes, Einon (1994) analyzed data from the national samples collected in Britain [] and France [] She found no evidence for the notion that there are more atypically "hypersexual" women compared to such men (and actually found evidence for a relatively greater incidence of "hypersexual" men who reported extremely large numbers of sex partners).

What about professional prostitutes? These women presumably have large numbers of male sex partners, yet may be less likely to be included in studies using typical sampling methodology. Einon (1994) also calculated the number of different male clients that prostitutes in Britain would need to service to resolve the gender discrepancy in self-reported lifetime number of sex partners in that country.
But Brewer, et. al. (2000) contradict this finding:
Brewer, et al.: Einon (18) addressed and dismissed the prostitution explanation for the discrepancy in the British household survey (5). However, her analysis of the lifetime number of reported partners is undermined by the use of point and annual, rather than lifetime, prevalences of prostitutes, and thus does not adjust for the cumulative number of partners that all prostitutes from multiple cohorts had over respondents' lifetimes.

[...]

After adjusting for these prostitution-related factors, the ratios for the sex discrepancy in the reported number of sexual partners hover slightly above and below 1 [] indicating that prostitution can account for essentially all of the disparity.
Weiderman examines some other possible explanations in his '97 article.
Several authors have noted that, compared to women, men tend to select sex partners who are relatively younger and such a gender difference in partner choice may affect self-reported lifetime number of sex partners... In other words, as most surveys involve adult respondents (age 18 years and older), some men included in the sample have had sex with female partners who are not old enough to be included in the survey. Although this fact may explain some small degree of the gender discrepancy, it cannot explain adequately the relatively large difference between men's and women's self-reports. That is, in national surveys, men typically report approximately three times as many lifetime sex partners as do women... Preference for pre-adult sex partners explains the apparent gender discrepancy in lifetime partners only if two thirds of adult men's partners are currently younger than age 18, which is a highly unlikely scenario...

Similarly, it would seem that if men begin their sexual careers earlier than do women, men would have a longer period of time in which to accumulate sex partners. However, any such difference in onset of sexual intercourse does not explain the gender discrepancy in lifetime number of sex partners because men still have to have a female partner, regardless of the age of the male. Additionally, at least among the most recent generation of young adults, there does not appear to be a gender discrepancy in age at first experience of sexual intercourse.
In fact, according to the CDC report (PDF), distribution of sexual partners in the 15-19% cohort is almost identical for each partner count; this would contradict the principle that young boys would be more likely to exaggerate their sexual experiences than older men. We'll see how this works out later, because it turns out they still do (just not on purpose).

Brewer, et. al. (2000) actually suggest that, far from exaggerating sexual conquests, men do not report contact with prostitutes when responding to surveys.
In two different parts of the Colorado Springs interview, heterosexual men were asked about contact with prostitutes in the last 5 years, with the second question referring to prostitutes in Colorado Springs only. Eleven of the 110 clients acknowledged prostitute partners only in response to the second question, and 2 additional men who did not report contact with prostitutes were known to be clients from prostitutes' naming them specifically as clients in another part of the interview.
However, it could be argued that Brewer, et al., in their enthusiasm at cracking the case, simply widened the gap: if the female sex-workers, representing 0.023% of the human population (of Colorado Springs, but they say that's representative) account for the entire difference, and men are reluctant to report contacts with prostitutes on surveys, then it's possible that they merely uncovered a huge cesspool of underreported sexual activity involving men and prostitutes.

(Actually, they imply that they can explain pretty much any discrepancy that could have been found with prostitutes. It's like "What Stumped the Bluejays." Since it could explain nearly any number you threw at them, I tend to suspect their study for that very reason. The other problem is, the study is mainly interested in establishing that (a) prostitutes account for a staggering volume of sex, and (b) men are reluctant to tell researchers that their impressive sexual CV's are padded with alleyway tricks. If that were true, however, it seems unlikely that this would have escaped the attention of so many different researchers with different methodologies.)

In any event, much of the discrepancy does indeed apply to a small number of men with large numbers of partners. Just as with income distribution at the high end, distribution of sexual partners doesn't follow a normal distribution; if it did, long lifetimes of celibacy or people like Bertrand Morane would appear once in a billion; in reality, they are quite common. Moreover, for women, large numbers of male partners tends to blur the gender division; according to the CDC study (p.12b), 32% of women with a lifetime count of ≥15 men had had same-sex encounters as well. For men, this tended to follow the plausible pattern of older men reporting more partners; only the >40 set had a >33% likelihood of reporting >15 partners (table 10). For women, only one ninth reached that level, but they did so earlier (25-29; see table 11); and after that age, the number slightly declined (!), suggesting that older cohorts of women offset their longer careers with a lower rate of new partners. The impression one gets examining table 11 is that a steady proportion of the respondents (20%) were adamant about having only one partner their entire lives—consistent with defining female religious narratives.

At last, we return to my preferred explanation: the unintentional classification scheme.
Norman Brown: It is well established that people use multiple strategies to generate numerical estimates, that different strategies are associated with explicable characteristic biases, and that strategy use is influenced by the availability of task-relevant information and the actual magnitude of the to-be-estimated quantity [] Of particular relevance, Brown (1995, 1997) demonstrated that people asked to estimate event frequencies sometimes retrieve and count event instances (i.e., enumerate) and sometimes produce rapid intuitive estimates (i.e., rough approximations). Participants who enumerate often underestimate event frequencies because relevant instances may be permanently forgotten, because output interference causes some instances to become temporally inaccessible, and because people sometimes terminate their retrieval efforts before all relevant instances have been recalled. In contrast, participants who produce rough approximations often overestimate event frequencies. It is believed that people generate these estimates by mapping vague quantifiers (e.g., terms like "quite a few," "lots") onto a numerical response scale and that this process produces overestimation because the lower bound of the response scale is anchored but the upper bound is not (Brown, 1995).

It is conceivable that some people enumerate when reporting their number of lifetime SPs and others respond with rough approximations. If so, all else being equal, people who enumerate should produce smaller estimates than people who use rough approximations. Thus, if we assume that the mean number of SPs is the same for men and women and that men and women respond in good faith, then we should find that men rely more on strategies associated with larger estimates (e.g., rough approximation) and women rely more on those associated with smaller estimates (e.g., enumeration). If this is the case, then differential strategy use can explain the sex difference in reports of lifetime SPs.
P6 was skeptical and hooted a little at this explanation:
How is this
...Some strategies...are associated with relatively large reports, others...are associated with relatively small reports, and that men are more likely to use the former whereas women are more likely to use the latter.
Any different that this?
P6: I think men lie about how many and women lie about how few.
The difference is that men use different methods ("strategies") of answering the question than women do, since women actually enumerate and men estimate. Bear in mind that I have no idea, since my lifetime total is pretty unambiguously fixed in my mind. Brown estimated that, when asked about totals during the preceding 12 months, gender discrepancies would disappear (which they certainly did).
An examination of the written protocols revealed that participants used several different strategies to generate their SP reports.(6) The most common of these was enumeration (e.g., "Counted all the names I remembered."); collapsing across sex, 39% of the sexually-active participants stated that they arrived at their estimates by recalling each of their partners. 29% used a tally-retrieval strategy. These people indicated that they maintain a tally in memory and that they responded to the lifetime question by recalling and stating the current value of this tally (e.g., "I kept track in my diary, and I know that my boyfriend is #27."). Another 17% indicated that their estimates were rough approximations. Protocols were assigned to this category when participants indicated that they generated their responses without carefully examining the available evidence. Such estimates were often accompanied by an expression of uncertainty (e.g., "Rough guess, give or take 1 or 2 partners"). In addition to these common strategies, 11% of the participants produced protocols that were too vague to be coded (e.g., "Memory") or that included only irrelevant information, 2% used a rate-based strategy (e.g., "Avg of 5/year from 16-21, then remained monogamous."), and 1% failed to respond.

[...]

In contrast to the lifetime estimates, the past-year SP estimates provided by the sexually active men (M = 3.45) were not significantly larger than those provided by the sexually active women (M = 2.58), t(173) = 1.26, ns. This replicates a common finding in the survey literature (ACSF Investigators, 1992; Johnson et al., 1992; Laumann et al., 1994; Morris, 1993; Smith, 1992) and has two important implications. First, the past-year data argue against the possibility that the sex difference reported above arose because our participants were responding in bad faith; if they had been, there should have been a reliable sex difference for both lifetime and past-year estimates. The past-year data also address an alternative explanation for the partner discrepancy reported above. One could argue that the men in our sample were actually more experienced than the women, and that the reported difference in estimated life-time SPs merely reflected this fact. However, given that the male and female participants were about the same age, and assuming that the men in this sample had more partners than the women, a sex difference should have been apparent in the past-year estimates as well as the lifetime estimates. Because the data do not support this prediction, we conclude that it is unlikely that men and women were drawn from qualitatively different samples.
And that's the difference.


NOTES:
mode: in statistics, the mode is the value that appears most commonly in the set. So, for example, if you have 100 people, and 10 of those people have had >10 sexual partners each, while the remaining 90 have had anywhere from 1 to 10 evenly distributed, then you would have 9 with one, 9 with 2,... 9 with 10, and the mode would be >10 since there are 10 with more than ten. You might even be incited to remark, "The group generally has more than partners each," which would convey a very erroneous impression even if >10 is the most common number of partners.

In the example cited, the mode is >4; if there were 60 "promiscuous" men & 15 "promiscuous" women, then the mode for the men would be >4, while that for the women would be 0. In Solar Soul's original version, the mode for both is 0.

Female religious narratives: coming from an evangelical protestant background, I have a fairly large amount of experience with testimonies by women and men about their religious epiphanies. It's relatively common for men to regale me with speeches about their past, raunchy life; sometimes they exaggerate, as I was sometimes encouraged to do. I can't lie convincingly, so I just opted out. The man typically describes a life ridden with sex and drugs, with something goofy thrown in (video games come to mind), then talks about being saved by God and united with his doting wife. Perhaps it was just me, but I would always read a certain humiliation in the wife's blissful smile; she was the healthy salad with rice crackers, not the slab of steak and baked potato skins with the English pint of ale.

In contrast, the women had a narrative that was very long on descriptions of mental states, and short on a backstory of actual, you know, sin. I use my mother as a canonical example: she would refer to a period of utter moral degeneration. When I was younger, I tried to get some clues about what cosmic depths of Dennis-Hopperesque depravity she'd sunk to. After one especially purple session, she finally spilled the beans: sometimes she didn't tithe. I would like to have seen the look on my face when she said that. Since that time, I've noticed that such defining religious narratives, for women, are rigidly and scrupulously confined to what is a matter of public record.


READING & SOURCES: William D. Mosher, Anjani Chandra, & Jo Jones , "Sexual Behavior and Selected Health Measures: Men and Women 15–44 Years of Age, United States" (PDF-2005); Brewer, et al., "Prostitution and the sex discrepancy in reported number of sexual partners," The National Academy of Sciences (2000); Norman Brown, "Estimating Number of Lifetime Sexual Partners" Journal of Sex Research (1999); Michael W. Wiederman, "The truth must be in here somewhere" Journal of Sex Research (1997)

Jeff Grabmeier RE: research of Terri Fisher, "Women's sexual behaviors may be closer to men's than previously thought," Ohio State Research (2003): This article was designed to test the variance in women's and men's reporting of sexual experience under different interview regimes; generally, women were more susceptible to social pressures and context, whereas men tended to report the same thing regardless. One implication is that women tended to report larger numbers of sexual partners if they were likely to believe they were being tested for truthfulness on a polygraph. The implication is that the discrepancy reflects embarrassment about large numbers of partners, which shrinks as the embarrassment of being thought a slut is replaced by the embarrassment of being caught lying.

Labels: , ,

08 June 2007

The Curmudgeon's Fallacy

The belief that any preventive measure used to minimize risk of a catastrophe will be offset by increased human fecklessness. Put another way, the curmudgeon's fallacy maintains that items such as safety equipment or regulations will have almost no net impact on safety or health, since people will simply become more feckless. The curmudgeon's fallacy actually may be applied more broadly; it is not restricted to measures intended to improve safety and health. Essentially, the curmudgeon's fallacy applies to any social goal whatever.

WEAK FORM
The weak form of the curmudgeon's fallacy is (being the weak form) less of a fallacy. It holds that constraints and safety measures imposed externally (such as traffic safety laws) will have little or no net impact on safety, since people will merely assume they are protected. Similarly, people with health insurance will be more careless with their health, people with airbags will drive more carelessly, people with legal protections against fraud or false advertising will be more easily duped.

In this sense, the assumption is not so much a fallacy when it is understood as a critique of policy measures. It is valid to say that people might respond to a protective measure by being less cautious about that particular risk. In some cases, such as unwanted pregnancies, it's probably true that massively relaxed social sanctions against extramarital pregnancies have indeed increased their frequency. However, this involves a confusion of changing consequences with changing motivations. Today, few people believe extramarital pregnancies are so awful that it would be sensible to execute unwed mothers. More on that, below.


STRONG FORM
In its strong form, the curmudgeon fallacy believes measures taken by oneself to prevent a catastrophe are as futile as those imposed from outside. For example, when I was younger I used to find healthy-living enthusiasts utterly tiresome and silly, and (privately) ridiculed the fact that they were usually sickly, joyless people. After decades of living and observing, I understand that people usually take up such lifestyles, as I did, in response to specific problems: changing metabolisms, risks of heart disease, incipient obesity, and so forth. Usually, people with congenital health problems run into this concern immediately. I would wait until I looked in the mirror and gagged at what I saw.

The strong-form curmudgeon's fallacy is more related to a contempt for the illusion of effective action. Eating greasy hamburgers with a mountain of fries and a milkshake is actually a very pleasant activity; it's natural to resent the voice that tells one to switch to rice crackers and steamed asparagus. It's natural to sneer that we're all going to die anyway. However, this is another fallacy: that a result is inconsequential if it doesn't last forever. Murder merely hastens the inevitable, but we still regard it as a horrible crime. Democratic institutions are going to disintegrate into despotic ones, some day, but that doesn't mean they're worthless while they last.

More directly, the strong-form curmudgeon's fallacy maintains that self-imposed safety restraints are really a failure to accept the weak-form version of the fallacy. To illustrate this point, suppose somebody reads an article that says that using sunscreen greatly reduces the risk of skin cancer. So she starts wearing the proper SPF sunscreen whenever she's outdoors. In effect, she's acting as if there was some law that required her to do this, even though no such law exists and would be extremely difficult to enforce anyway. She's internalized the expert advice. We assume here that she will abandon alternative precautions, like avoiding exposure to direct sunshine altogether. The strong form appears to reflect a global assumption that new precautions, such as use of sunscreen or cars with airbags, does not reflect caution by the adopter, but displaces caution--even when the person taking the precaution is doing so precisely because she is cautious.

MATHEMATICAL FORM
The curmudgeon's fallacy can be expressed in the language of mathematics. Let Pd be the probability of a disaster (e.g., a fatal auto accident). Pc is the probability of a crisis occurring, such as a car accident (which may or may not be fatal); Pl is the probability of that crisis being lethal.
Pd = Pc x Pl; Pd >> 1
In order to suffer a fatal car accident (Pd), one has to have been in an accident (Pc) that is lethal (Pl). Now, suppose we install airbags in cars, reducing Pl. If Pc remains the same as before, Pd will go down. According to the curmudgeon fallacy, that is absolutely out of the question. Indeed,
meaning that the unintended consequence (ΔPc/Pc) is necessarily greater than the thing affected by human will, and
it is necessarily of opposite sign.

According to the curmudgeon's fallacy, it makes no difference if it is Pc or Pl that is consciously altered; if a legal measure were contrived to reduce Pc instead, causing accidents to be less likely, then accidents would become more lethal. Public policy will invariably increase Pd. At the very least, if by some miracle, the number of fatalities per passenger is demonstrably reduced, then some other awful thing must have happened.

In some cases, it is true that unintended consequences do indeed have the opposite sign and sometimes they do exceed the intended effect. Moreover, as the curmudgeon is the first to point out, there are orthogonal consequences as well. Too many regulations will interfere with each other or suppress productive activity. Safety regulations often do have perverse incentives on behavior or personal health choices. This has led to the introduction of game theory to the analysis of public policy. However, it is most rash to insist that it's always the case. This is why the expectation of large countervailing consequences is a good critique but a poor ideology.

INCIDENCE OF THE FALLACY
Typically, when conservative older men congregate, examples of the curmudgeon's fallacy tend to receive a cordial hearing. The common myth is that airbags tended to make drivers so much more careless that they offset the increment in safety (example). Of course, the authors use the example of the seatbelt:
This surprising result has triggered a number of studies, most of which have come to similar conclusions. In fact, no jurisdiction that has passed a seat belt law has shown evidence of a reduction in road accident deaths. To explore this odd but highly robust finding, experimenters asked volunteers to drive five horsepower go-karts with and without seat belts. They found that those wearing seat belts drove their karts faster. While this does not prove that car drivers do the same, it points in that direction.

A similar study was done with real drivers on public roads. When subjects who normally did not wear seat belts were asked to do so, they were observed to drive faster, followed more closely, and braked later. Statistics from the United States indicate that as more and more states required seat belt use, the percentage of drivers and passengers killed in their seat belts increased.

The cliche that seat belts save lives is true in the lab and on paper, and it's true if driver behavior does not change. But behavior does change.
Of course, if the share of motorists wearing seatbelts increases sharply, the share of motorists killed in accidents wearing seatbelts will also increase, simply because there will always be accidents that would have killed the motorist anyway. Likewise, the author cites a test that shows that motorists responded to wearing seatbelts by driving faster, braking later, and following other vehicles more closely. The author cites no actual study, which leads me to suspect the auto industry commissioned these studies (since the auto industry has long opposed any form of health or safety regulation of its products).

A careful reading of the literature reveals that the author is assuming his readers have a poor understanding of statistical inference. In order to test something like homeostatic responses to safety regulations, one has to use regression analysis with hypothesis testing to confirm or deny the null hypothesis (viz., that seatbelts have no effect on driving behavior). The study involved can then use a Wald Test on that particular null hypothesis, which means they can confirm that while safety equipment has a low predictive value on behavior, it may be part of a battery of predictive factors that do.

Yet, elsewhere, where the author cites a study (?) that fails to prove that seatbelts had a year-on-year reduction of traffic fatalities, the null hypothesis would be that seatbelt laws had no detectable effect on traffic fatalities. Since a law usually has a slow impact on behavior, this is an inevitable result. Over a period of four years, the p-value (i.e., the robustness of the coefficient) for seatbelt laws on traffic fatalities would necessarily be quite small.

However, law enforcement officials, private sector insurance carriers, and medical personnel at hospitals reliably warn motorists to wear seatbelts. From year to year, there is a distinct downward trend in traffic fatalities per passenger mile; this is slightly surprising given increases in road congestion, especially at hours late into the night. Cars have undergone numerous waves of safety-enhancing technology modifications besides seatbelts; these modifications have been adopted in many countries, reflecting agreement across ideological regimes. Additionally, there are long-term changes in attitudes about pedestrians that have nothing to do with increased motorist protection and everything to do with suburbanization of the population.

In other words, the author of the article inserted very different standards for testing behavioral homeostasis and for testing regulatory effectiveness; the standard for homeostasis could be set very low, perhaps by allowing a Wald Test; whereas, for regulatory effectiveness, the standard of rigor was markedly lower—the p-value of laws had to be less than 0.05, a nearly impossible standard in public policy research. Laws have a lagged effect on behavior, and auto safety is very complex; since any hypothesis testing may have included autocorrelation effects, dummy variables for many other explanatory variables (like jurisdictions), and a counting parameter for the passage of time, it's almost inevitable that the coefficient on seatbelt laws could be reduced to something quite small.

Finally, the essay leaves open the question, was the unintended consequence greater than the intended effect? Since the tendency has been for traffic fatalities to go down, and since private sector initiatives as well as governmental ones work the same way, it seems clear that the curmudgeon's premise has failed. Traffic regulations may have made drivers more dangerous, but the increased recklessness of modern drivers combined with greater congestion, has not sufficed to offset the aggregate effect of safety equipment and traffic regulations. Even the essay cited had to insert the weasel words, "fatality rates do not decrease as expected." They decreased, but he has some straw man out there of what was "expected" by activists.

Environmental regulations often come under attack as well; for example, using the flimsiest empirical foundations of all (the case of one [1] listed species), one of the posts at Freakonomics claims that the Endangered Species Act incentivizes property owners to destroy all of the listed specimens on their property lest development on their property be restricted. Of course, that's about all there is to Freakanomics: arguments that any public choice will have countervailing effects, QED, public choice is always bad and must be dismissed in all times and all places.

CONCLUSION: A PHILOSOPHICAL ASIDE
I never dared to be radical when young for fear it would make me conservative when old.—"Precaution," Robert Frost 1936
The curmudgeon's fallacy is that paradox of paradoxes: a precaution against precaution. A man I know well and much respect was addicted to the fallacy and used it reliably, since he was so well-endowed with natural caution and a singularly robust constitution. Once I mentioned how scandalized I was, reading Adam Smith's Wealth of Nations, about the stupendous infant mortality of 18th century Europe. He replied that he was not so sure infant mortality was such a bad thing, and insisted that I explain why I thought it was. It was a curious quirk of his character that his ideology had no part in his behavior, and he was of all men one of the most tender and generous, even though such brutal ideas flourished in his head.

At the back of the curmudgeon's fallacy is a sense that the lifelong struggle to preserve life has been a fool's errand; and in the waning years, as excellence seems to fade, there's a regret that no distinction was made between fit life and unworthy life. The curmudgeon usually lacks the will and barbarism to follow this through; but he also develops an imbalanced preference for his own "gut" prejudices over the research and formal testing of experts. At the back of this mistrust is a sense that the professional pursuit of safety, peace, and prosperity has merely spawned weakness and dependency, and that what the world really needs is a good, long epidemic to weed out the weak. As for me—I am not Lycurgus, nor was meant to be.

Labels: , ,

07 June 2007

Employers failing to train underskilled IT workers

This story in Computerworld (NZ) caught my eye. It's about IT professionals in the UK, but it certainly conforms to my experience in the USA.

Learning and skills council E-Skills UK figures show that skills shortages among companies that are recruiting IT staff are at a two-year low of 6%. But the same proportion of employers also reported skills gaps among their existing professional IT staff in the last quarter of 2006, the latest issue of E-Skills UK's ICT Inquiry report says. The gaps centre on business-related and other nontechnical skills, "which implies that employers are taking on sub-skilled staff and doing little to up skill them following their recruitment", the report warns.

[See footnote below for info on skills shortage measuring—JRM]

Please note information on skills shortages come from employer surveys; there's no customer satisfaction survey I'm aware of to measure skills among service populations.

The Register, an UK-based publication, reports that the main problem is skills levels among senior government officials in IT functions, rather the opposite of the generalization in Computerworld. But a further examination reveals the connection: IT recruiters tend to hire experienced staff, but that staff has few business skills. On the other hand, civil servants in the increasingly IT-intensive British government tend to lack understanding of technology issues. In the reports cited by both articles, a "gap" is much-noted, rather like a communications crevasse between business management and IT professionals.

For those unfamiliar with the concept of skills shortages (and measuring them numerically), I recommend a visit to the website of National Statistics (UK). There one may find "Skills shortages" (PDF), by Mari Lind Frogner (2002).
The Employers Skill Survey (ESS) provides two definitions of lack of skills. The first is skills shortages, defined as recruitment difficulties caused specifically by a shortage of individuals with the required skills in the accessible labour market. Alternatively, there are skill gaps which are deficiencies in the skills of an employer’s existing workforce, both at the individual level and overall, which prevent the firm from achieving its business objectives. Skill gaps can be defined in two ways: a broad definition includes all establishments that reported that at least some of their staff lacked full proficiency; a narrow measure includes only those establishments where a significant proportion of the workforce was reported lacking full proficiency.
[Emphasis added—JRM]
The skills shortage is sort of like a reverse-unemployment statistic; it reflects a shortage of available employees owing to inadequate skills. Usually it is expressed as a number of employees desired, but unavailable. When it is expressed as a percentage, it is the shortage divided by employment in that sector.

Labels: